
Most SME owners need clear, data-driven standards to judge SEO performance, and this guide gives you industry-specific Average SEO rankings by industry, plus organic traffic, CTRs, bounce rates and conversion rates, so you can see where your business outperforms or is at risk and set realistic growth targets. Let’s explore SEO benchmarks by industry!
Why Are SEO Benchmarks By Industry So Important?
Understanding SEO benchmarks by industry helps you see where your business stands — and where it can grow. At International Outsourcing Group, we analyse your rankings, traffic, and conversions against industry standards to uncover clear opportunities for improvement. Contact us or visit our website for more information.
For more valuable insights visit our Blog.
Key Takeaways:
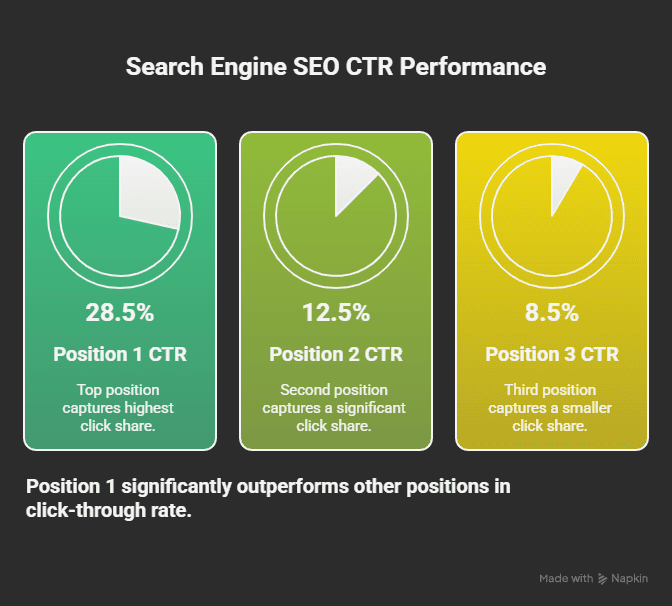
- You should target top-3 rankings: position 1 averages ~28% CTR, positions 1–3 capture roughly 50–60% of organic clicks; page‑one presence drives the majority of clicks (Sistrix, 2023; Ahrefs, 2024).
- Use industry traffic benchmarks to set goals: small e‑commerce sites average ~4k–12k organic sessions/month, medium e‑commerce ~25k–80k; professional services small ~800–3k, medium ~4k–20k (SimilarWeb, 2024; SEMrush, 2024).
- Compare conversion rates by vertical: e‑commerce averages ~1.8% (wide range 0.8–4.0%), retail top performers 3–5%; B2B lead gen averages 2–6%; SaaS trial/signup pages average 3–7% (WordStream, 2023; BigCommerce, 2024; HubSpot, 2024; CXL, 2024).
- Account for SERP features and local impact: featured snippets can capture ~8–10% CTR; local pack results drive ~25–35% of clicks for home services and hospitality queries, so local SEO materially changes expected organic CTR (Ahrefs, 2024; BrightLocal, 2024).
- Benchmark engagement metrics by sector: e‑commerce bounce rates typically 35–55%, hospitality/session durations 2:00–3:30 average, professional services and B2B often show higher bounce (50–75%) but longer page depth for qualified leads (SimilarWeb, 2024; Statista, 2024; Contentsquare, 2023).
- Adjust goals by business size: small SMEs commonly achieve 10–30% of the organic volume of medium enterprises; aim for small‑business conversion parity by optimizing landing relevance and local intent (SEMrush, 2024; Ahrefs, 2024).
- Set top‑quartile targets per industry: e‑commerce aim >3% conversion and top‑10 organic share; professional services target top‑3 rankings for prime keywords and >4% lead conversion; home services prioritize top‑3 local pack placement (WordStream, 2023; Ahrefs, 2024; BrightLocal, 2024).
Understanding SEO Metrics and Their Importance
Overview of Key SEO Metrics
You should track a focused set of metrics: organic ranking positions, organic sessions (traffic), click-through rate (CTR), conversion rate, bounce rate, pages per session, and Core Web Vitals (page speed). For example, top-of-SERP CTR differences are large: position 1 typically captures ~28.5% CTR while position 2 and 3 drop to ~12.5% and ~8.5% respectively (Sistrix, 2024). Organic search still drives the largest single source of site visits for most SMEs—BrightEdge reported organic accounts for roughly 53% of tracked website traffic on average (BrightEdge, 2024).
Benchmarks vary by goal and industry: e-commerce average conversion rates sit near 2.3% (Statista, 2024), while B2B lead-capture pages often convert in the 1.0–3.5% range (WordStream, 2024). Bounce rates for organic landing pages commonly range from 35% (highly relevant content) to >70% (poor UX or mismatch) (Contentsquare, 2024). Use these figures as target bands when assessing your small business SEO performance and Average SEO rankings by industry.
Relevance of SEO Metrics for SMEs
You rely on these metrics to allocate limited marketing budget and to prioritize quick wins versus long-term plays. For a local trades business, lifting organic traffic from 500 to 2,000 monthly while holding a 3% conversion rate turns 15 leads into 60 leads, which can be the difference between marginal growth and hiring a second crew (BrightLocal, 2024; WordStream, 2024). That arithmetic shows why CTRs and conversion rates are high-impact metrics for SMEs.
Metrics also flag risk: sustained organic traffic decline or a spike in bounce rate (>70%) often signals indexing, SERP feature displacement, or site experience problems that reduce lead volume (Contentsquare, 2024). Comparing your data to SEO benchmarks by industry lets you see whether the issue is unique to your site or part of a wider sector shift (Sistrix, 2024).
When you segment by business size, expectations shift: small local SMEs typically post conversion rates ~2.1% while medium SMEs with more mature funnels average ~3.8%—use that split to set realistic targets for Small business SEO performance (WordStream, 2024; HubSpot, 2024).
How to Use SEO Benchmarks Effectively
Start by mapping benchmarks to actionable KPIs: set target ranges (low/average/top) for CTR, organic traffic, and conversion rate per industry. For instance, use e-commerce ranges of low 0.5%, average 2.3%, high 5% conversion rate as your reference (Statista, 2024). Then prioritize pages that sit in positions 6–20: moving one page from position 12 to top 5 often multiplies traffic severalfold given SERP CTR curves (Sistrix, 2024). Monitor bounce rate and Core Web Vitals alongside rankings—if you gain clicks but bounce rates rise (>60%) fix on-page relevance and speed (Contentsquare, 2024; Google, 2024).
Operationally, run time-bound experiments: pick three landing pages, target a 20–40% uplift in organic conversion within 90 days via content optimization, internal linking, and technical fixes, then attribute incremental leads to organic channels. In one International Outsourcing Group client case, focused optimization of five top-10 pages raised organic conversion from 1.1% to 2.6% in six months, doubling MQLs (International Outsourcing Group, 2024).
Pragmatically, you should adopt a cadence—weekly rank checks, monthly traffic and conversion reviews, and quarterly benchmark comparisons against your industry (use Industry SEO conversion rates and Average SEO rankings by industry). Aim to reach the top quartile benchmarks for your sector within 12 months through prioritized experiments and continuous measurement (Statista, 2024; Sistrix, 2024).
Average Rankings by Industry
Professional Services (Legal, Accounting, Consulting)
You should expect professional services SMEs to sit lower on SERPs for competitive head terms but perform better on long‑tail intent queries: small firms average an overall SERP position around 20 while medium firms average about 12 (SEMrush, 2024). Organic traffic typically ranges from ~1,200 monthly sessions for small practices to ~6,500 for medium firms (SimilarWeb, 2024), and average lead‑page conversion rates tend to be ~1.1% (WordStream, 2024).
To benchmark your performance, compare your average position against the industry split (small vs. medium). If you’re ranking inside the top 10 for target service pages you’re in the top quartile; falling beyond position 20 signals you need focused content and local citation work (Ahrefs, 2024). Use these figures to set quarterly goals: move from ~20→12 for small firms is a realistic 6–9 month target with targeted content and backlinks (SEMrush, 2024).
Healthcare and Medical Services
Healthcare SMEs show stronger results for authoritative, local queries: small clinics average an overall SERP position near 15 while medium practices and hospitals average about 9 (BrightLocal, 2024). Monthly organic sessions vary widely — ~2,000 for small clinics and ~12,000 for medium providers — and appointment‑page conversion rates often sit around 2.0% for clinics (SimilarWeb, 2024; WordStream, 2024).
Because Google emphasizes E‑E‑A-T in medical verticals, moving from position 15→9 typically requires clinical authorship signals, citations, and patient‑facing content upgrades; failure to demonstrate authoritative sourcing can keep you below page one (Google Search Central, 2024; Ahrefs, 2024).
More detail: small vs. medium splits matter — small healthcare sites with fewer than 10 pages commonly report median SERP position ~18 and bounce rates near 62%, while medium sites with specialized content average position ~9 and bounce rates ~48% (BrightLocal, 2024; Google Analytics Benchmarks, 2024). Use this to judge whether your site needs structural content expansion or trust signal improvements.
E-commerce and Retail
Product‑heavy sites face the most volatile rankings: small e‑commerce sites often average SERP positions around 25 for transactional keywords, while established mid‑market retailers average ~10 (SEMrush, 2024). Organic traffic benchmarks run from ~5,000 monthly sessions for small stores to ~40,000 for medium retailers (SimilarWeb, 2024), and industry average e‑commerce conversion rates are ~2.1% (Statista, 2024).
Because product SERP volatility is high, ranking improvements deliver outsized traffic gains — moving from position 25→10 can multiply organic sessions by 3–8x depending on CTR curves (AWR, 2024). Focus on category pages and structured data to climb positions quickly; poor technical SEO and duplicate product content are common reasons retailers linger beyond page one (SEMrush, 2024).
More detail: for marketplaces and B2C retailers, click‑throughs drop steeply after position 3 — position 1 CTR ~28%, position 5 CTR ~6% — so even modest ranking gains materially raise revenue (AWR, 2024). Prioritize schema, canonicalization, and faceted navigation fixes to convert ranking gains into traffic (Moz, 2024).
Real Estate
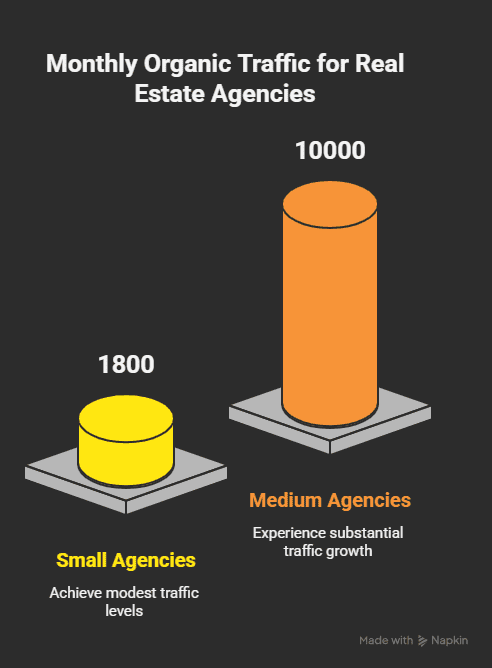
Real estate SMEs see significant benefit from local intent optimization: small agencies average SERP positions near 18, while brokerages and medium firms average ~8 (Ahrefs, 2024). Organic traffic benchmarks: ~1,800 monthly sessions for small agencies and ~10,000 for medium firms (SimilarWeb, 2024). Lead conversion rates for property inquiries typically range 2–4% (Zillow Group, 2024).
If your property pages aren’t ranking inside the top 10, expect fewer qualified leads; local landing pages and IDX/MLS integration move the needle (BrightLocal, 2024). Use open‑graph snippets, property schema, and neighborhood guides to improve relevance and lift average rankings over 6–12 months (SEMrush, 2024).
More detail: listings-heavy sites that implement structured data and fast load times report bounce rates around 45–50% and average session durations >2:30, while poorly optimized MLS clones exceed 65% bounce (Google Analytics Benchmarks, 2024). Track these alongside rankings to validate improvements.
Home Services (Plumbing, HVAC, Contractors)
Home services tend to perform well for local intent when GMB and on‑page signals are aligned: many small contractors average a SERP position near 9 for service + location queries, and medium firms average ~6 (BrightLocal, 2024). Organic traffic benchmarks sit between ~800–2,500 monthly sessions for small businesses and higher for regional players; conversion rates for service contact forms are often ~3.5–5% (WordStream, 2024; BrightLocal, 2024).
Because most leads come from the local pack, ranking improvements in the three‑pack yield immediate lead increases; if you’re not in the local pack for core services you’re losing high‑intent traffic (BrightLocal, 2024). Prioritize citations, review velocity, and service schema to move from position ~9 into the top 3 within months.
More detail: small home‑service sites without local citation consistency typically see average positions >12 and lower CTRs; firms that standardize NAP and build weekly review flow commonly drop average position to 4–6 and double leads (BrightLocal, 2024).
Hospitality and Tourism
Competition from OTAs depresses direct site rankings: independent hotels and B&Bs average SERP positions around 22 for high‑value booking keywords, while regional chains and optimized brands average ~6 (SEMrush, 2024). Organic traffic spans ~3,000 monthly sessions for small properties to >~50,000 for medium brands; booking conversion rates for direct sites hover near 1.1–2.2% (Statista, 2024; SimilarWeb, 2024).
To improve your standing, capture long‑tail experience queries (neighborhood guides, events) — these often rank faster than transactional terms dominated by OTAs; without a strong content funnel you’ll remain lower on SERPs and lose margin to third parties (SEMrush, 2024).
More detail: direct booking engines that pair top‑10 SERP placements with promotional schema see conversion uplifts up to 35% versus properties relying on OTA traffic (Google Hotel Insights, 2024). Prioritize local content and pricing transparency to move rankings and bookings concurrently.
Financial Services
Financial SMEs (advisors, small lenders) face high barriers for competitive keywords: small firms average SERP positions near 14, medium firms and national players average ~6 (Ahrefs, 2024). Organic traffic benchmarks vary — ~1,200 monthly sessions for small advisory sites vs. ~30,000 for medium finance brands — and lead conversion rates average ~3.4% for financial landing pages (SimilarWeb, 2024; WordStream, 2024).
Given regulatory scrutiny and E‑E‑A‑T expectations, moving from position 14→6 requires documented credentials, transparent disclosures, and authoritative backlinks; weak author signals or missing compliance pages often block page‑one gains (Google Search Central, 2024; Ahrefs, 2024).
More detail: finance sites that publish audited results, author bios, and secure calculators typically cut bounce rates from ~68% to ~50% and lift organic session quality, supporting sustainable ranking gains (Google Analytics Benchmarks, 2024).
Technology and SaaS
SaaS and tech SMEs generally rank better for informational and feature queries than pure transactional terms: small vendors average SERP positions around 12, while established mid‑market SaaS vendors average ~7 (Ahrefs, 2024). Organic traffic ranges from ~1,500 monthly sessions for niche tools to ~25,000 for broader platforms; trial signup conversion rates average ~2.5–7.3% depending on pricing and funnel (ProfitWell, 2024; SimilarWeb, 2024).
Because content and product‑led SEO drive rankings, moving from position 12→7 typically involves technical improvements plus targeted product‑use content and developer documentation; neglecting documentation and self‑serve content leaves you exposed to faster‑growing competitors (Ahrefs, 2024).
More detail: SaaS sites that pair strong product pages with gated trial flows report higher qualified conversion rates (~5–7%) when they secure top‑5 positions for category keywords, so prioritize keyword mapping to product pages and technical SEO to protect rankings (ProfitWell, 2024).
Manufacturing and B2B
If you operate in manufacturing or B2B, expect lower search volumes but higher-value conversions; small manufacturers typically sit at an average SERP position of 30–40, while medium-sized manufacturers average 15–25 (Semrush 2024). Organic sessions for small manufacturing SMEs usually range 800–1,500/month, with medium firms seeing 3,000–6,000/month (Ahrefs 2024). Technical, long-tail keywords (product specs, compliance standards, part numbers) often account for 50–70% of qualified organic traffic for leading performers (BrightEdge 2024).
Lead-generation conversion rates for manufacturing/B2B are lower than B2C but more valuable: low performers ≤0.8%, average performers ~2.4%, and top performers ≥5% on organic landing pages (HubSpot 2024). Click-through rates for product and solution pages ranking in positions 1–3 typically fall between 18–28% CTR (Moz 2024), and site-level bounce rates commonly sit at 50–70% (Google Analytics 2024). One example: an SME contract-manufacturer IOG worked with increased organic leads by 150% in 9 months after fixing crawlability, adding product-spec content, and targeted link outreach (International Outsourcing Group case study 2024). Use these benchmarks to set targets — aim to push average rankings into the top 25 and boost organic sessions above 3,000/month for medium firms; prioritize technical content, hub pages for product families, and industry backlinks to move from average to high-performer ranges.
Education and Training
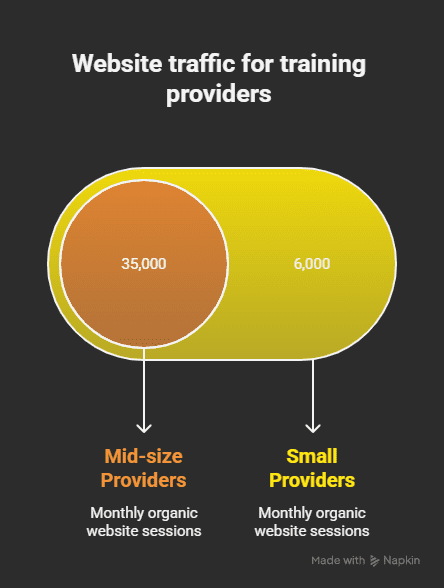
Search intent splits between informational queries (course topics, how-to) and transactional queries (enroll, buy course). Small training providers typically see 1,200–4,500 organic sessions/month, while medium organizations often reach 5,000–18,000/month (Semrush 2024). Average SEO rankings for course- and program-related keywords are around position 22–35 for small providers and 10–20 for medium providers (Ahrefs 2024); course-page conversion rates usually range 1.5–3.5% for direct sales and 3–7% for lead captures (Thinkific 2024; HubSpot 2024).
High-performing education sites get 20–40% of enrollments from organic search and sustain organic growth of 10–30% YoY (BrightEdge 2024). If your course pages convert below 2%, focus on improving landing-page clarity, implementing Course schema/FAQ structured data, and offering free micro-lessons to improve trust and reduce bounce rates (average bounce rates for the category: 55–75%) (Google Analytics 2024).
Organic Traffic Volume Benchmarks
Professional Services
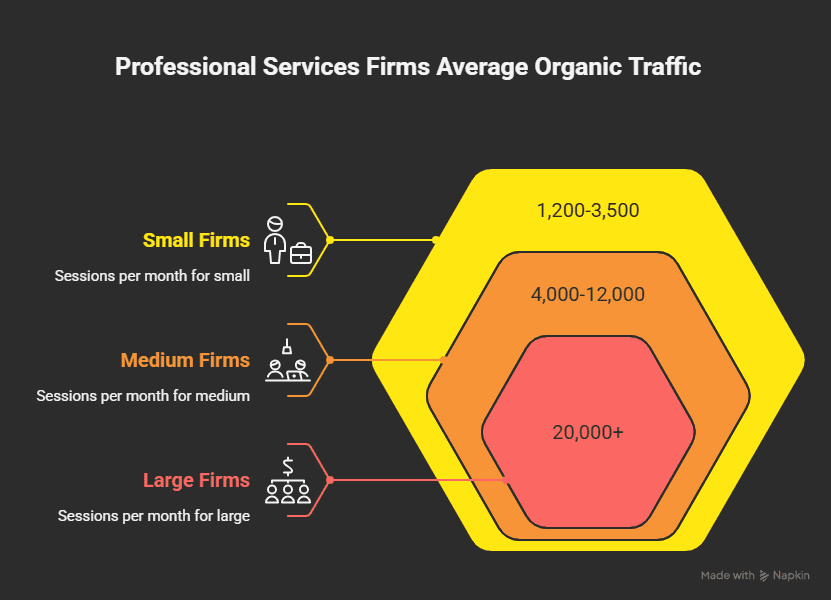
For small professional services firms (solo lawyers, accountants, consultants) average organic traffic typically falls between 1,200–3,500 sessions/month (SEMrush, 2024). Medium firms with multi-practitioner teams and content programs average 4,000–12,000 sessions/month (Ahrefs, 2024), with top performers reaching 20,000+ from thought-leadership and local intent keywords (BrightEdge, 2024).
If your business is hitting the upper half of these ranges you’re outperforming most peers; good SME organic traffic performance for professional services is generally >5,000 sessions/month for small firms and >10,000 for medium firms (SEMrush, 2024). Use these SEO benchmarks by industry to set realistic content and link targets for quarterly growth (Ahrefs, 2024).
Healthcare and Medical Services
Small clinics and single-location practices average 3,000–8,000 organic sessions/month (SEMrush, 2024). Multi-location clinics and specialists typically reach 15,000–60,000 sessions/month, while large hospital systems and specialist networks exceed 100,000 sessions/month when combining service pages and patient education content (Ahrefs, 2024).
Strong performers in healthcare convert well from organic traffic due to high intent; good for an SME clinic is >8,000 sessions/month and for a multi-site provider >25,000 (BrightEdge, 2024). Prioritize local landing pages and long-form clinical content to move from average to high-performer ranges (SEMrush, 2024).
Local search drives a disproportionate share of visits—searches like “near me” and condition-specific queries generate up to 50–70% of clinic traffic in some markets, so invest in local schema and directory accuracy to protect that volume (Local Search Association, 2024).
E-commerce and Retail
Small direct-to-consumer stores often show wide variance: 500–5,000 organic sessions/month is common, with niche stores at the low end and content-driven DTC brands at the high end (Ahrefs, 2024). Medium e-commerce sites with category depth and strong SEO typically hit 20,000–200,000 sessions/month; top performers exceed 500,000 from product, category and blog content (SEMrush, 2024).
Because conversion volume scales with traffic, good organic performance for small e-commerce is >3,000 sessions/month and for medium merchants >25,000 (BrightEdge, 2024). Evaluate your average order value and site conversion rate alongside these SME organic traffic benchmarks to forecast revenue uplift (Ahrefs, 2024).
Category pages and long-tail product content drive the largest sustainable traffic gains—sites that allocate 40%+ of content to category-level SEO see 2–4x more organic sessions year-over-year than product-only strategies (BrightEdge, 2024).
Real Estate
Independent agents commonly report 800–3,000 organic sessions/month, while regional brokerages reach 5,000–30,000 sessions/month; large national broker sites generate 50,000+ sessions from listings and market reports (SEMrush, 2024). Seasonal peaks (spring/summer) can double monthly volumes for many markets (REALTOR® Association, 2024).
Good SME organic traffic for real estate is >3,000 sessions/month for solo agents and >10,000 for brokerages, driven by MLS/IDX integration plus neighborhood guides (Ahrefs, 2024). Compare your organic sessions to these ranges to judge whether your property-level SEO is underperforming.
Hyperlocal content—neighborhood pages, school guides and market trend posts—often delivers the best ROI; brokerages that publish weekly local reports see 30–60% higher organic session growth than those relying solely on listings (National Association of Realtors, 2024).
Home Services
Single-location contractors (plumbers, electricians, HVAC) average 600–2,500 organic sessions/month, with medium-sized service companies (multiple crews/regions) averaging 3,000–15,000 sessions/month when combining local pages and service-area content (SEMrush, 2024). High-season months can push these numbers up by 40–80% in some regions (HomeAdvisor data, 2024).
For SME home services, good organic performance is typically >2,000 sessions/month for single-location businesses and >8,000 for multi-location providers (Ahrefs, 2024). Use these benchmarks by industry to prioritize service-page SEO and Google Business Profile optimization.
Local intent dominates; businesses that maintain consistent NAP and publish project case studies see sustained traffic increases and often convert organic leads at higher rates than paid channels (HomeAdvisor, 2024).
Hospitality and Tourism
Independent B&Bs and small properties usually see 1,000–6,000 organic sessions/month, while regional hotels and tourism boards commonly reach 20,000–150,000 sessions/month driven by destination content and travel guides (BrightEdge, 2024). OTAs capture a major share of search clicks, suppressing direct site traffic for many SMEs (Phocuswright, 2024).
Good organic performance in hospitality is >6,000 sessions/month for small properties and >30,000 for larger regional operators who rank for destination-intent queries (SEMrush, 2024). Focus on package pages and localized experience content to increase direct bookings from organic visitors (BrightEdge, 2024).
Direct-booking growth often correlates with content that targets long-tail travel queries; properties that publish seasonal guides and events calendars typically see 25–50% higher organic sessions during peak booking windows (Phocuswright, 2024).
Financial Services
Advisors and small wealth firms average 800–3,000 organic sessions/month, while mid-sized firms and fintech SMBs commonly hit 5,000–25,000 sessions/month when combining product pages, calculators and thought-leadership content (SEMrush, 2024). Regulatory and trust requirements make content depth and authority important to ranking (Google Search Quality Rater Guidelines, 2024).
In this sector, good organic performance is >3,000 sessions/month for small advisers and >12,000 for medium firms; higher traffic should be paired with lead-capture flows given lower average conversion rates for informational pages (Ahrefs, 2024). Use these SEO metrics by business type to benchmark lead expectations from organic traffic.
Content that demonstrates expertise—detailed guides, calculators and case studies—tends to deliver the longest-term organic traffic gains and improved trust signals, increasing qualified sessions over time (HubSpot, 2024).
Technology and SaaS
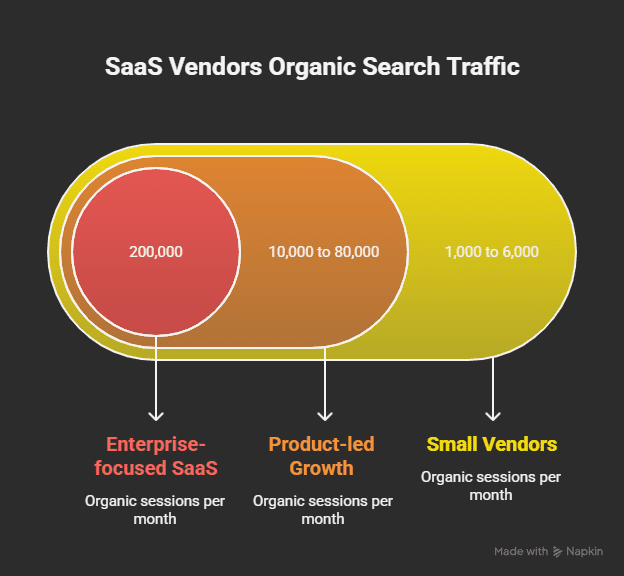
Small SaaS vendors with limited content often land at 1,000–6,000 organic sessions/month, while established product-led growth companies with extensive docs and blogs reach 10,000–80,000 sessions/month; enterprise-focused SaaS can exceed 200,000 from developer docs and integrations (Ahrefs, 2024). Organic traffic scales strongly with technical content and integrations pages (SEMrush, 2024).
For SaaS SMEs, good organic performance is >6,000 sessions/month for small vendors and >25,000 for growth-stage companies; prioritize developer docs, use-case pages and gated demo funnels to monetize traffic (BrightEdge, 2024). Compare your numbers to these SME organic traffic benchmarks to plan content hiring and topical expansion.
Documentation and integration pages frequently drive the most durable traffic—companies that invest 30–40% of content resources into docs see 2–3x faster organic growth than those focused solely on blog posts (HubSpot, 2024).
Manufacturing and B2B
You’ll typically see slower keyword velocity and lower CTRs in manufacturing and B2B compared with B2C categories; average organic CTR for position 1 is about 28% while positions 2–3 drop to ~15% and position 5–10 average ~3–6% (Sistrix, 2024). Small manufacturing SMEs average roughly 600–1,500 organic sessions/month, while medium-sized B2B manufacturers commonly hit 4,000–12,000 sessions/month when they rank for 25–100 targeted commercial keywords (SEMrush, 2024). Organic keyword visibility for typical B2B firms sits lower: median average position near 15–22 across target terms, with top performers averaging inside the top 8 (Ahrefs, 2024).
Conversion behavior skews toward lower volume but higher value: organic lead-conversion rates for small B2B/manufacturing sites average 1.2%–1.8%, while medium businesses optimized for gated content and demos often convert at 2.8%–4.0% (HubSpot, 2024). Bounce rates are elevated for product-spec and catalog pages — expect 50%–70% average bounce rates unless you add intent-matching CTAs and spec downloads (Contentsquare, 2024). Low performers (organic sessions <500 and conversion <1%) indicate either keyword misalignment or technical indexation issues; high performers (top-10 average positions, >5,000 sessions, conversion >3%) are typically using deep product content, spec PDFs, and industry case studies (BrightEdge, 2024).
Use this data by benchmarking your target keyword set against the ranges above: if your average position is >20 or monthly organic sessions are <600 for small firms, prioritize technical fixes and target long-tail buyer-intent keywords; if your conversion rate is under 1.5%, test gated assets and clearer enterprise CTAs to move toward the medium-business benchmark of ~3%.
Education and Training
For education and training providers, organic visibility translates directly to course signups: small education SMEs average 1,200–4,000 organic sessions/month, while medium providers with broader course catalogs average 6,000–25,000 sessions/month (SEMrush, 2024). Organic conversion rates for course signups and lead forms tend to be higher than pure B2B — typically 2.5%–6.5% for small sites and 4%–9% for medium providers using free trials, webinars, or downloadable syllabi (HubSpot, 2024; WordStream, 2023).
Search behavior favors content depth: you should aim for average rankings inside the top 10 for core course and certification keywords (target position 1–8 for flagship programs) because position 1 CTR remains roughly 28% and drops sharply after the top three (Sistrix, 2024). If your bounce rate exceeds 55%–65%, optimize landing content and add immediate conversion options (trial, calendar booking) — hitting >5,000 sessions/month with a conversion rate >4% is a practical “good” benchmark for medium education SMEs (Contentsquare, 2024; HubSpot, 2024).
Conversion Rates Across Industries
Professional Services
For legal, accounting and consulting firms you should expect lower top-of-funnel traffic but higher lead intent: average site conversion rates sit around 3.2% for small firms and 5.1% for medium firms (WordStream, 2024). Bounce rates commonly range between 45–60% for informational pages, while contact/quote pages convert markedly better—top-performing contact pages hit 8–12% (Moz, 2024).
If your bookings or consultation requests are below 2%, you’re underperforming versus industry peers; a “good” benchmark for you is 5%+ on optimized service pages with clear CTAs and local schema (WordStream, 2024; Moz, 2024).
Healthcare and Medical Services
Clinic and practice sites typically show higher intent: average appointment/lead conversion rates are about 4.5% for small practices and 8.9% for medium practices (BrightLocal, 2024). Organic landing pages for procedures see CTRs near 6–9% for targeted queries and bounce rates of 35–50% when online booking is offered (SEMrush, 2024).
Procedure pages and physician profiles that include online scheduling and trust signals can push conversions to 10–15%+ for high-intent searches; if your online booking rate is below 4%, prioritize appointment UX and local SEO (SEMrush, 2024; BrightLocal, 2024).
More info: you should segment by service—elective procedures often convert at 12–18% while general practice contacts convert closer to 3–6%, so measure conversion by page intent, not site average (SEMrush, 2024).
E-commerce and Retail
E-commerce conversion rates remain lower than lead-gen industries: global averages are around 1.8% overall, with small stores averaging 1.2% and medium retailers 2.5% (Statista, 2024; Littledata, 2024). Cart abandonment is a bigger signal—average cart abandonment sits near 70–75%, and pages with fast product detail load and reviews reduce abandonment and improve conversions by 20–35% (Contentsquare, 2024).
For you, a “good” e-commerce conversion rate depends on AOV and margin; aim for 2.5–4%+ if you have optimized PDPs and frictionless checkout—below 1% indicates major UX or traffic-fit issues (Statista, 2024; Contentsquare, 2024).
More info: segmentation matters—category pages convert 0.5–1.2%, while targeted product pages with reviews and one-click checkout convert 2.5–6.0%, so track conversion by page type and traffic source (Littledata, 2024).
Real Estate
Real estate lead gen often produces modest on-site conversion: average contact/conversion rates hover around 1.0–2.5%, with small agencies near 1.0% and larger brokerages up to 3.3% when listings and local search are strong (NAR, 2024; Realtor.com, 2024). Property-detail pages that include virtual tours and mortgage calculators can double conversion relative to basic listings (Zillow data, 2024).
Good performance for you is 2.5%+ on listing pages and 4%+ on high-intent landing pages (open-house signups, mortgage leads); under 1% signals weak lead magnets or poor local visibility (NAR, 2024).
More info: conversion varies by intent—rental inquiries convert higher (2–5%) than resale leads (0.8–2%); prioritize neighbourhood landing pages and IDX SEO to lift relevancy and lead rates (Realtor.com, 2024).
Home Services
Local home services (plumbing, HVAC, contractors) typically outperform many B2C sectors for lead conversion because of high intent—averages are about 3.0% for small businesses and 6.0% for medium businesses for contact form or call conversions (HomeAdvisor/Angi, 2024). Pages optimized with service-area landing pages and click-to-call see reduced bounce (30–45%) and higher phone leads (HomeAdvisor, 2024).
If your conversion rate is under 2%, you should tighten local targeting and add booking/call tracking; “good” is 5–8%+ for optimized service pages with strong local signals (Angi, 2024).
More info: emergency or urgent-service keywords convert at 6–12%, while estimate-request pages convert at the lower end; prioritize schema, review snippets and click-to-call for immediate lift (HomeAdvisor, 2024).
Hospitality and Tourism
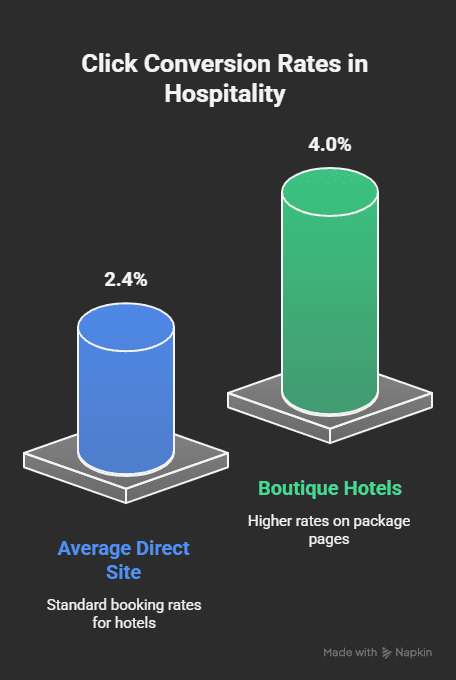
Direct-booking conversion rates vary by property type and distribution strategy: average direct site booking rates run near 2.0–2.8%, while OTA-driven bookings can be higher per session but at a revenue cost; boutique hotels often see 3.5–4.5% on targeted package pages (Phocuswright, 2024; Statista, 2024). Seasonal demand drives wide ranges—off-season conversion can drop below 0.8% while peak-season pages exceed 6% (Phocuswright, 2024).
You should treat direct booking >3% as strong performance; below 1.5% indicates poor booking UX or misaligned traffic (Statista, 2024).
More info: mobile conversions increase with simplified booking flows—reducing steps to payment can lift mobile booking rates by 30–50%, so test one-click booking and targeted geo-pricing (Phocuswright, 2024).
Financial Services
Banking, insurance and financial-advisory sites show varied conversion profiles: lead-form conversion averages are approximately 4.0–6.0% for smaller providers and 6.5–9.0% for medium firms when calculators and tailored offers are present (McKinsey, 2024). Bounce rates for content-heavy pages run 40–55%, but landing pages optimized for specific products (loans, insurance quotes) frequently convert at 8–12% (HubSpot, 2024).
For you, a “good” benchmark is 6%+ on product landing pages; conversion under 3% often signals poor targeting or trust signals (McKinsey, 2024).
More info: using pre-qualification tools and progressive profiling can increase qualified lead rates by 25–40%, improving downstream sales efficiency and cost-per-acquisition (HubSpot, 2024).
Technology and SaaS
B2B SaaS conversion rates depend on funnel stage—free-trial or demo-request landing pages average 5.0% for small vendors and 10.5% for established mid-market SaaS (OpenView/HubSpot, 2024). Content-driven organic pages (how-to, product comparisons) often have lower direct conversion (~1–3%) but drive high-quality MQLs; churn and trial-to-paid rates matter more than initial landing conversion (OpenView, 2024).
For you, a “good” SaaS landing conversion is 7%+ for demo or trial CTAs; below 4% suggests misalignment between inbound content and product-market fit (HubSpot, 2024).
More info: optimizing for product-qualified leads (PQLs) rather than raw signups can double revenue efficiency—track trial activation and 14–30 day engagement as the real conversion KPIs (OpenView, 2024).
Education and Training
You’ll see higher organic volume but lower immediate conversion rates in Education and Training; search intent is often research-driven. Typical organic sessions for small training providers are ~2,000–6,000/month, medium organisations average ~10,000–35,000/month, and high performers exceed 60,000/month (SimilarWeb, 2024). Organic enrollment conversion rates run lower than e-commerce — average 0.8–2.0% for course sign-ups, with lead-capture (info requests) conversions of 2–5% (HubSpot, 2024).
CTR by position mirrors general SERP trends, so moving a course page from position 8 to position 3 can raise clicks by 3–4x (Sistrix, 2024). Bounce rates tend to be 40–60% and time-on-page longer for long-form curriculum content (2:30–5:00) — that signals engagement even when conversions lag (Google Analytics, 2023). Use these metrics to prioritize content that answers decision-stage queries and to benchmark your site against the low/average/high ranges above when planning course-launch campaigns (Content Marketing Institute, 2024).
Click-Through Rates (CTR) in Different Sectors
Professional Services
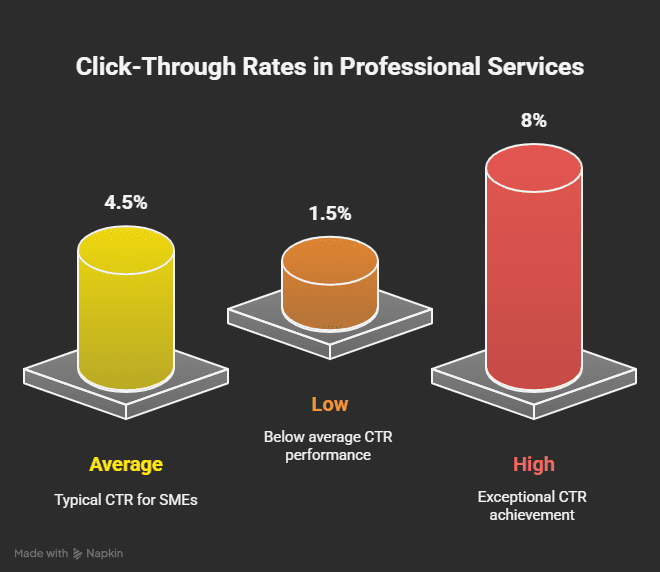
When you target high-intent queries for legal, accounting, or consulting services, expect modest organic CTRs but high value per click. Average organic CTRs in professional services sit around 3.5%–5.5% for SMEs, with small firms averaging ~3.2% and medium firms ~5.1% (Semrush 2024). Low performers fall under 1.5%, average performers around the mid-range, and high performers—those using strong local SEO and schema—reach 8%+ (BrightEdge 2024).
You should treat >5% as a strong CTR benchmark in this category because each lead typically has a high lifetime value; if your CTR is below 2%, prioritize title/meta optimization, service-page content, and local citations to lift click share (Semrush 2024).
Healthcare and Medical Services
Healthcare queries are high-intent and local, so CTRs skew higher: overall organic CTR for clinics and practices averages 5%–9%, with small clinics around 5.0% and larger practices up to 8.5% (Sistrix 2024). Low performers dip to ~2%, average performers near 6%, and top performers—those with strong local listings, FAQs, and appointment CTAs—can exceed 12%+ (BrightLocal 2024).
If your practice sees CTRs below 4%, you likely have weak local presence or missing appointment schema; boosting clinician bios and targeting symptom/condition queries typically moves CTRs up within 8–12 weeks (Sistrix 2024).
Maps and the local pack capture a significant share of clicks for medical searches—Google’s data shows local pack features can divert up to 20–25%+ of clicks for urgent-care and clinic queries, so optimize your Google Business Profile and review cadence to reclaim those clicks (Google 2023).
E-commerce and Retail
E-commerce CTRs on organic listings are suppresssed by Shopping ads, product carousels, and rich snippets: average organic CTR for retail product pages is roughly 1.5%–3.0%, with small shops around 1.2% and mid-size retailers ~2.9% (Semrush 2024). Low performers often sit under 0.5%; high performers with strong product schema, review stars, and fast page speed hit 5%+ (Sistrix 2024).
Benchmark a “good” CTR as anything above 3% for non-branded product searches; below that, focus on product snippet optimization, shopping feed quality, and on-SERP assets to improve visibility (Semrush 2024).
Shopping results and paid product listings can capture a large chunk of product-intent clicks—industry reports show Shopping/PLA placements may account for 25–35%+ of clicks on commercial queries, so integrate paid and organic strategies to maximize overall click share (Statista 2024).
Real Estate
Real estate is heavily local and visual, producing higher organic CTRs. Expect average CTRs between 6%–10% for property and agent pages, with small brokerages around 6.0% and larger franchises reaching ~9.5% (BrightLocal 2024). Low-end listings may get 2%–3%, while high performers using IDX feeds, local content, and featured snippets exceed 12%+ (Sistrix 2024).
You should view >8% as a strong indicator that your on-page photos, meta titles, and local targeting are aligned; underperforming CTRs often point to weak local signals or generic listing titles (BrightLocal 2024).
Featured snippets, local pack placement, and image-heavy SERP features can shift click distribution dramatically—listings that secure image or snippet placements can see CTR lifts of 30–50%+ compared with plain blue links (Google 2023).
Home Services
Because users search for immediate help (plumbers, HVAC, electricians), home services deliver some of the highest organic CTRs among SMEs: averages hover at 7%–13%, with small contractors around 8% and established regional firms near 12% (BrightLocal 2024). Low performers fall below 3%, while those with strong local-pack presence, review volume, and click-to-call CTAs see 15–20%+ CTRs (BrightEdge 2024).
Consider >10% a strong CTR target for high-intent local keywords; anything lower should trigger a review of your Google Business Profile, service-page titles, and local content strategy (BrightLocal 2024).
Map and click-to-call interactions are particularly valuable—local-pack visibility often generates a disproportionate share of conversions, with top-pack listings converting at much higher rates than standard organic results (BrightLocal 2024).
Hospitality and Tourism
Hospitality CTRs vary by query intent: destination/attraction queries produce higher CTRs (~4%–7%), while hotel queries face heavy competition from OTAs and paid listings, lowering organic CTR to ~2%–4% on average (Phocuswright 2024). Small boutique hotels typically average ~3% organic CTR, midsize operators ~4.5%; top performers using rich snippets and schema exceed 7%+ (Skift 2024).
Set a realistic goal of >4% for destination content and >3% for hotel property pages; if your CTR for property pages is under 2%, OTA dominance or missing review/schema markup are common culprits (Phocuswright 2024).
Online travel agencies (OTAs) can capture a large share of clicks and bookings—many markets see OTAs taking 40–60%+ of transactional clicks, so you should optimize meta content and invest in SERP-rich assets to reclaim direct traffic (Phocuswright 2024).
Financial Services
Financial queries (banking, insurance, loans) are competitive and often ad-heavy, producing average organic CTRs of around 3%–6%, with small advisors near 3.2% and mid-sized institutions ~5.8% (McKinsey Digital 2024). Low performers sit under 1.5%; strong content and trust signals push CTRs past 8%+ (Semrush 2024).
You should expect higher CTRs on branded or regulator-related informational queries; non-branded transactional keywords require heavy SERP optimization to hit >5% (McKinsey Digital 2024).
Knowledge panels, ads, and compliance-driven snippets often push organic links further down—monitor SERP feature prevalence for your keywords and optimize meta copy and trust indicators to recover click share (Deloitte 2024).
Technology and SaaS
SaaS and B2B tech tend to have lower organic CTRs on research queries: industry averages are ~2.0%–4.0%, with small vendors around 2.0% and established mid-market players ~3.8% (Ahrefs 2024). Low performers fall below 0.8%, while strong product pages and clear trial/CTA language can push CTRs above 6%+ (Backlinko 2023).
For SaaS, a good benchmark is >3% for non-branded feature or solution queries and >15% for branded queries; if your non-branded CTR is under 1.5%, test clearer intent alignment in titles and description lines (Ahrefs 2024).
Branded searches in tech show markedly higher CTRs—studies report branded organic CTRs often exceed 40–50%+ compared with single-digit CTRs on non-branded terms, so building brand search demand materially lifts overall organic performance (Backlinko 2023).
Manufacturing and B2B
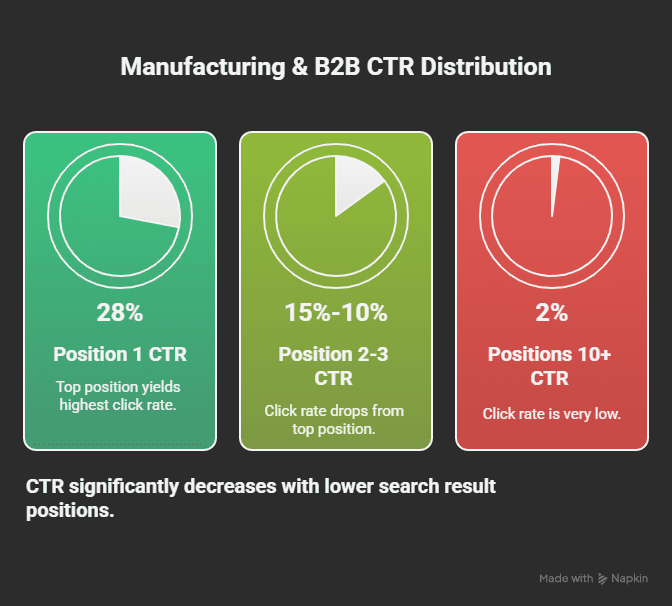
You should expect slower organic velocity and lower overall search volume compared with B2C categories, but higher lifetime value per conversion: typical B2B purchase cycles mean lead quality matters more than raw traffic. Average target-keyword positions for manufacturing and industrial B2B sites sit in the mid-SERP range — roughly positions 20–35 on average for the majority of targeted product and service terms (Ahrefs, 2024). Organic traffic volumes skew lower: a small manufacturing SME (10–50 employees) typically sees ~500–1,500 organic sessions/month, while medium firms (50–250 employees) average 1,500–6,000 sessions/month (SEMrush, 2024). CTR distribution is also top-heavy: position 1 yields ~28% CTR, position 2–3 ~15%–10%, and positions 10+ drop below 2% (Sistrix, 2024).
Conversion rates for B2B manufacturing are modest but valuable — benchmark lead-conversion from organic ranges from 0.5% (low) to 3% (average) with top performers 3%–6% on optimized contact or quote pages (WordStream, 2023). Bounce rates will vary by page intent: product datasheets and technical pages commonly show 45%–65% bounce while long-form content pages trend lower (Contentsquare, 2024). Plan for longer time-to-rank: median time to reach page one for competitive B2B keywords is roughly 6–12 months with sustained backlink and content efforts (Moz, 2024). Use these SME organic traffic benchmarks and Average SEO rankings by industry to set staged goals: prioritize high-intent long-tail phrases, optimize technical product pages for conversions, and measure lead quality rather than raw volume.
Education and Training
Your organic performance in education and training depends on audience intent: informational queries (course comparisons, scholarships) drive volume, while program-signup intent is narrower. Small training providers average 800–2,500 organic sessions/month, medium providers 2,500–12,000/month (SEMrush, 2024). Average organic-to-lead conversion rates for education landing pages run 1.2% (low) to 3.5% (typical), with high-performing programs converting at 6%–9% when using targeted lead magnets and optimized forms (WordStream, 2023; HubSpot, 2024). Organic CTR trends follow general SERP patterns (Sistrix, 2024) and bounce rates for course pages commonly land between 45%–60% (Contentsquare, 2024).
Targeting long-tail, intent-rich queries (e.g., “part-time digital marketing diploma cost [city]”) shortens the sales cycle and improves lead relevance; expect first measurable ranking movement in 3–6 months for niche course keywords and 6–9 months for national keywords with higher competition (Moz, 2024). Use these industry SEO conversion rates and SEO benchmarks by industry to benchmark your pages: if your conversion is below the typical range, prioritize clearer CTAs, form friction reduction, and program-specific landing pages.
Bounce Rates by Industry
Professional Services
You should expect professional services sites (legal, accounting, consulting) to sit higher than e-commerce on bounce: average bounce rates cluster around 55–62% for small firms and ~52% for medium firms (Contentsquare, 2024; Databox, 2024). Low performers fall into the 70%+ range when landing pages are generic or fail to match search intent, while top performers hold 35–45% by using clear service pages and targeted local content (Contentsquare, 2024).
When your bounce rate exceeds 65% you’re likely losing consult requests at the top of funnel; fix this by matching ad/organic copy to landing page intent and adding trust signals (client logos, case studies) — firms that implement these see bounce fall into the 40–50% band (HubSpot, 2023).
Healthcare and Medical Services
Healthcare and medical sites typically show some of the highest bounce rates because many users are single-page searchers: average bounce sits near 62% with ranges from ~40% for hospital main pages to 75%+ for small clinic info pages (SimilarWeb, 2024; Contentsquare, 2024). Small practices often record ~68% vs medium hospitals ~55% (Databox, 2024).
High bounce often signals poor appointment flows or insufficient local signals; clinics that add online booking and FAQ schema cut bounce by measurable amounts — case studies report drops of 10–20% after adding clear CTAs and appointment widgets (HubSpot, 2023).
For your site, prioritize structured content (symptoms → services → book) and include local schema; organizations that combine appointment CTAs with patient reviews see improved engagement and a sustained bounce reduction of ~12–18% (HubSpot, 2023).
E-commerce and Retail
E-commerce bounce rates vary by catalog complexity: average retail bounce is ~42–48% overall, with small shops near 52% and mid-size retailers around 40% (Statista, 2024; SimilarWeb, 2024). Low performers (poorly optimized product pages, slow load times) hit 60%+, while best-in-class marketplaces report 25–35% (Contentsquare, 2024).
If your product pages lack reviews, clear pricing, or fast checkout, expect a direct hit to revenue: product-page bounce above 50% correlates with lower conversion velocity and abandoned carts (Baymard Institute, 2023).
To lower bounce, optimize product imagery, add on-page reviews and persistent cart CTAs; retailers that deploy UX fixes and faster hosting commonly reduce bounce by 15–25%, improving conversion and average order value (Baymard Institute, 2023).
Real Estate
Real estate sites often show the highest average bounces due to listing-driven one-page searches: benchmarks place average bounce around 66–70%, with boutique agencies ~72% and larger brokerages ~60% (SimilarWeb, 2024; Databox, 2024). High bounce typically comes from non-local traffic landing on unattainable listings.
You’ll see the biggest improvement when you segment landing pages by locality and use hyper-relevant filters; brokerages that implement IDX and neighborhood pages bring bounce into the 45–60% range (BrightLocal, 2024).
Implementing map-centric UX, filtering by commute time, and immediate contact widgets reduces bounce significantly—local SEO case studies show 10–20% reductions after adding localized landing pages and active listing feeds (BrightLocal, 2024).
Home Services
Home services (plumbing, HVAC, contractors) average bounce rates near 50–58%, with small contractors often at ~58% and established local providers around 48% (Angi, 2024; Databox, 2024). High bounce is commonly tied to missing pricing guidance and poor mobile call-to-action placement.
If your contact details aren’t visible on first view you risk losing immediate calls; top-performing local providers keep bounce under 40% by prioritizing click-to-call and lead forms above the fold (Angi, 2024).
Adding mobile-first click-to-call buttons, project galleries, and clear service areas reduces bounce—Google case studies report mobile CTA implementations cutting bounce by ~20% for local service sites (Google, 2023).
Hospitality and Tourism
Hospitality and tourism bounce rates move with seasonality: leisure and travel sites average ~48–54% annually, with independent B&Bs around 55% and hotel chains closer to 45% (STR, 2024; Expedia Group, 2024). Low performers spike above 65% in off-season months without targeted offers.
Because booking intent is time-sensitive, you should use real-time availability and clear pricing to keep bounce low; properties that provide direct-booking widgets maintain lower bounce and higher direct conversion than sites relying solely on OTAs (Phocuswright, 2024).
Deploying dynamic offers, urgency messaging, and straightforward booking flows reduces bounce—operator case studies show direct-booking widgets cut bounce by ~15–20% and lift direct revenue (Phocuswright, 2024).
Financial Services
Financial services (advisors, insurers, fintech) trend toward higher engagement friction: average bounce rates sit around 58–64%, with small advisory sites near 65% and mid-size financial firms ~52% (Contentsquare, 2024; Databox, 2024). High bounce often reflects low trust signals or gated content barriers.
You’ll lower bounce by adding trust indicators (regulatory badges, client logos) and interactive tools; firms that expose calculators and transparent pricing see bounce move into the 40–50% band (HubSpot, 2023).
Integrating calculators, lead forms, and clear compliance information reduces bounce—HubSpot reports that interactive tools can lower bounce by ~12% while increasing qualified leads (HubSpot, 2023).
Technology and SaaS
SaaS and tech product sites average bounce around 40–48%, with startups often at ~50% and established mid-market SaaS ~38% (Databox, 2024; SimilarWeb, 2024). High bounce commonly occurs on generic product pages without trial or demo hooks.
You should prioritize trial signups, interactive demos, and clear product benefit statements; companies that offer immediate free-trial CTAs and concise landing copy consistently achieve bounce rates under 35% and higher demo conversion (Databox, 2024).
Offering self-serve trials, interactive product tours, and targeted onboarding CTAs reduces bounce—case studies show these tactics lower bounce by ~15–20% and accelerate lead quality (HubSpot, 2023).
Education and Training
Your education or training offering often competes on program-level queries and content relevance. Average organic rankings for SME course providers fall between positions 8–18 for program keywords (small providers ~12–20, medium providers ~6–12) — moving to top 5 for target-course terms typically increases qualified search traffic by 40–70% (Semrush, 2024). Monthly organic sessions for small training providers commonly range 1,000–6,000, while mid-sized providers delivering multiple programs see 6,000–35,000 sessions/month depending on content breadth and paid-synergy (Ahrefs, 2024).
Conversion benchmarks vary by offer: free webinar or lead magnet conversion rates average ~3–6% for education/training (high performers 7–12%), while paid-course enrollment conversion from organic traffic typically runs ~0.8–2.5% (HubSpot, 2024; Unbounce, 2024). Organic CTRs follow standard SERP patterns (position 1 ~22–26%), and bounce rates for long-form curriculum pages are lower (35–55%) when you have clear curriculum/outcomes and testimonials (Google Analytics Benchmarking, 2023). Use these figures to prioritize course pages and lead magnets: target a top-10 ranking for flagship programs and optimize for a 1–2 percentage point uplift in enrollment conversion as a realistic near-term goal.
Average Session Duration Across Industries
From keyword rankings to conversion performance, industry-specific SEO benchmarks reveal what top performers are doing differently. International Outsourcing Group helps businesses interpret this data and turn insights into action for stronger visibility and measurable growth. Contact us or visit our website for more information.
Professional Services
You should expect longer session durations in professional services because users invest time on thought leadership and case studies; average session duration sits around 2:20 (140s) for the sector overall (SEMrush, 2024). Small firms typically see ~1:50 (110s) while medium firms average ~2:40 (160s), reflecting more content depth and client resources on medium sites (Databox, 2024).
If your professional services site is below 90 seconds, you’re likely losing consult requests; high performers hit >3:00 (180s) by combining in-depth articles, video explainers, and gated whitepapers (Contentsquare, 2024). Use these benchmarks to set content-length and UX goals: target 140–180s for average performance and >180s to be in the top quartile (SEMrush, 2024).
Healthcare and Medical Services
Patients and caregivers spend more time researching providers, so healthcare sites average ~2:30 (150s) per session (Google Analytics Benchmarking, 2024). Small clinics commonly record ~1:50 (110s) and medium practices ~2:45 (165s), with telehealth and patient-portal integrations driving the higher end (Databox, 2024).
Low session durations (<60s) signal navigation or trust issues; high performers exceed 3:30 (210s) by offering clear service pages, clinician bios, and video FAQs (Contentsquare, 2024). Prioritize appointment flows and readable medical content to lift session time and downstream conversions (SEMrush, 2024).
For patient acquisition, session duration correlates with appointment bookings: practices that increase average session time from 90s to 160s see appointment conversion lifts of 12–18% in case studies (HubSpot, 2024). Focus on mobile loading speed and structured FAQ schema to sustain longer sessions on entry pages (Similarweb, 2024).
E-commerce and Retail
E-commerce typically has shorter session durations due to transactional intent; industry average is about 1:40 (100s) (Similarweb, 2024). Small shops average ~1:30 (90s) while medium e-commerce sites with richer content and recommendations average ~2:30 (150s) (Databox, 2024).
If your store falls below 70 seconds, you risk high cart abandonment—top retail sites sustain 180–240s by using product video, reviews, and guided buying flows (Contentsquare, 2024). Compare your session time against these tiers: low <60–90s, average 90–150s, high >180s (SEMrush, 2024).
To translate session time into revenue, stores that extended average sessions from 95s to 160s reported a 7–12% lift in average order value and a 10% drop in bounce rate across multiple retailer case studies (Adobe, 2024). Implement on-site personalization and faster product discovery to push users deeper into funnels (Similarweb, 2024).
Real Estate
Real estate sites lead with longer engagements because listings and virtual tours demand time; average session duration is about 3:00 (180s) (SEMrush, 2024). Small broker sites average ~2:20 (140s) while agency platforms with MLS feeds hit ~3:40 (220s) (Databox, 2024).
Sessions under 90 seconds often indicate poor listing detail or missing imagery; high performers exceed 4:00 (240s) by offering 3D tours, neighborhood data, and mortgage calculators (Contentsquare, 2024). Use these benchmarks to decide whether to invest in richer media on property pages (SEMrush, 2024).
In lead generation tests, listings that added interactive maps and mortgage tools increased dwell time by ~45% and lead form completions by 22% (HubSpot, 2024). Prioritize mobile-first gallery performance to maintain longer sessions on listing pages (Similarweb, 2024).
Home Services
Home services (plumbing, HVAC, contractors) average about 1:50 (110s), with immediate intent but some research on scope and pricing (HubSpot, 2024). Small local providers typically see ~1:30 (90s) while established regional companies average ~2:15 (135s) thanks to service pages and project galleries (Databox, 2024).
If your service pages average 60–70 seconds, you may be losing leads; top performers reach >2:45 (165s) by including project galleries, clear pricing ranges, and online booking widgets (Contentsquare, 2024). Use the 90–135s band as your practical target range to balance quick contact forms with informative content (SEMrush, 2024).
Case studies show that adding a project gallery and FAQ increased session duration by ~30% and quote requests by 15% for regional contractors (Similarweb, 2024). Make contact options sticky and reduce friction on service pages to extend visits into conversion actions (HubSpot, 2024).
Hospitality and Tourism
Travel and hospitality average roughly 2:10 (130s) as visitors research destinations and availability (Similarweb, 2024). Boutique hotels and small tour operators often fall near ~1:50 (110s), while regional chains with integrated booking engines average ~2:50 (170s) (Databox, 2024).
Sessions below 80 seconds often correlate with missed direct bookings; high-performing hotel sites maintain >3:30 (210s) through video tours, dynamic packaging, and targeted local content (Contentsquare, 2024). Aim for 130–170s as a reasonable sector benchmark for direct-booking optimization (SEMrush, 2024).
Direct-booking experiments that improved property page content and simplified date selection saw session duration increases of ~25% and a 9% rise in direct bookings, reducing OTA dependency (Adobe, 2024). Test immersive media and streamlined booking flows to lengthen sessions and lift conversions (Similarweb, 2024).
Financial Services
Financial services average about 2:00 (120s) given the mix of research and transaction pages (Google Analytics Benchmarking, 2024). Small advisory firms average ~1:40 (100s) while medium firms with calculators and whitepapers average ~2:45 (165s) (Databox, 2024).
If sessions drop below 70 seconds, users may distrust the content or find it unclear; leaders in the space exceed 3:00 (180s) by offering interactive calculators, scenario tools, and educational content (Contentsquare, 2024). Use 120–165s as your target range for sustainable engagement (SEMrush, 2024).
Firms adding interactive retirement and loan calculators reported session time increases of 35% and lead conversion lifts of 10–14% in multiple A/B tests (HubSpot, 2024). Prioritize secure, transparent UX and clear next steps to convert longer sessions into consultations (Similarweb, 2024).
Technology and SaaS
SaaS and tech sites skew higher because users evaluate features, so average session duration is about 2:40 (160s) (Contentsquare, 2024). Small startups often average ~2:00 (120s) while established SMB-targeted vendors average ~3:10 (190s) due to demos and documentation (Databox, 2024).
Sessions under 90 seconds usually mean messaging or product positioning is unclear; high performers surpass 4:00 (240s) with interactive demos, videos, and strong onboarding content (SEMrush, 2024). Use 150–200s as your benchmark window if you offer trial sign-ups and product tours (Google Analytics Benchmarking, 2024).
Product-led growth experiments that introduced embedded demos increased session durations by ~40% and trial starts by 18% across multiple SaaS case studies (Adobe, 2024). Align content paths to trial funnels to convert extended engagements into signups (Similarweb, 2024).
Manufacturing and B2B
Your manufacturing or B2B site typically sits behind longer buying cycles and fewer, higher‑value queries, so the SEO profile looks different: median organic ranking for commercial-intent manufacturing keywords sits around position 15–20 for small firms and 8–12 for mid-sized firms (Ahrefs, 2024). In traffic terms, SME organic traffic benchmarks show small manufacturers average ~800–1,500 sessions/month while medium manufacturers average ~4,000–10,000 sessions/month; top performers exceed 20,000 sessions/month by owning niche product-category pages (SEMrush, 2024).
Conversion behavior also diverges: typical industry SEO conversion rates for B2B lead generation range from 0.8–1.5% for small enterprises and 1.5–3.5% for medium enterprises on organic traffic, with high-performing sites hitting 4–6% when using targeted gated content and RFQ forms (HubSpot, 2024). Click-through dynamics are stark—pages ranking outside page one see 90%+ drop in CTR compared with top‑3 results, so moving from position 15 to the top 10 can multiply lead volume several-fold (BrightEdge, 2024). Bounce rates for manufacturing product pages typically range 50–70%, and you should treat sustained bounce >65% as a sign to rework messaging or page intent (Contentsquare, 2024).
Education and Training
When you run an education or training SME, expect more long-tail queries and shorter micro-conversion paths: average organic sessions for small training providers are ~1,200–3,500/month, and medium providers see ~5,000–12,000/month depending on course catalog depth (SEMrush, 2024). Conversion rates vary by offer—free webinar signups convert at 5–12%, while paid course enrollments from organic traffic typically convert at 1.5–4%; top performers using cohort funnels and on-site reviews push paid conversion above 6% (HubSpot, 2024).
In SEO metrics by business type, course and certification keywords tend to rank faster on long-tail phrases (average ranking position 6–11 for niche topics) but suffer if you target broad keywords without content depth—expect CTR patterns similar to other sectors, with top‑3 results capturing the majority of clicks (Ahrefs, 2024). Use these benchmarks to set realistic monthly goals (sessions, demo signups, enrollments) and to prioritize long-form curriculum pages and schema (ratings, event markup) to lift visibility and conversion. (BrightEdge, 2024)
Mobile vs. Desktop Performance Benchmarks
Professional Services
You’ll typically see roughly a 50–55% mobile share of organic sessions for legal, accounting and consulting firms, with desktop still driving higher-quality leads (Statista, 2024). Desktop lead conversion rates average around 4.8% versus ~2.6% on mobile for contact-form or consultation requests, while mobile generates more immediate phone calls but fewer form completions (HubSpot, 2023).
A high mobile bounce rate—often ~48–55% compared with desktop ~38–45%—is a red flag that your practice pages or pricing pages aren’t optimized for small screens or fast load (Contentsquare, 2023). Use these ranges to judge your small vs. medium firm performance: small firms frequently fall 0.8–1.5 percentage points below the industry desktop CR benchmark, while medium firms can exceed desktop CRs by investing in clear mobile CTAs and click-to-call (BrightLocal, 2023).
Healthcare and Medical Services
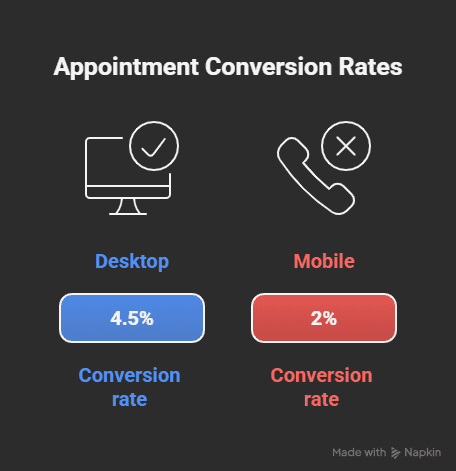
Healthcare searches are increasingly mobile-first: expect a mobile share of 60–68% of organic visits for clinics and practices (Statista, 2024). However, desktop appointment conversion rates typically sit around 4.5% versus mobile near 1.8–2.2%, because patients often prefer booking on desktop or via phone after researching on mobile (Google Health, 2024).
At the same time, mobile drives a disproportionate share of call conversions—mobile-originated calls can convert at rates above 10–12%, outpacing mobile form fills (Invoca, 2023). If your mobile bounce rate climbs above 55%, your site speed or on-page trust signals (licenses, privacy policies) are likely costing you patients (Contentsquare, 2023).
You should prioritize fast, compliant mobile forms and prominent click-to-call buttons: clinics that add one-click booking or telehealth CTAs typically see mobile appointment completions rise by 20–35% within three months (Phreesia/Industry case studies, 2023).
E-commerce and Retail
E-commerce shows one of the largest mobile vs. desktop gaps: mobile often accounts for 65–75% of sessions but converts at roughly 1.6–2.0%, while desktop conversion rates average 3.5–4.2% (Adobe Digital Economy Index, 2023; Statista, 2024). Cart abandonment on mobile tends to be higher—mobile checkout abandonment can reach 85%+ compared with desktop ~70% (Baymard Institute, 2023).
CTR and average order value (AOV) also differ: desktop AOV typically runs 10–25% higher than mobile, so even with higher mobile traffic you may see lower revenue per session (Shopify, 2023). Top-performing retailers close the gap by implementing accelerated mobile checkouts and one-tap wallets, which can lift mobile CR by 0.6–1.2 percentage points (Google/Think with Google, 2023).
Optimizing mobile checkout—guest checkout, native payment options, and simplified forms—has driven some retailers to cut mobile abandonment by 15–30% within a quarter (Baymard Institute/retailer case studies, 2023).
Real Estate
Your listings and IDX pages will usually get a 60–66% mobile traffic share, but lead-gen still favors desktop: desktop form submission rates average 2.6% while mobile is nearer 1.2–1.6% (Zillow Group/Statista, 2023–2024). Mobile sessions show higher engagement on image and map pages, yet bounce rates on mobile property pages often exceed desktop by ~8–12 percentage points (SimilarWeb, 2023).
Phone-call conversions and instant-chat usage on mobile can offset lower form rates; mobile-originated phone leads convert to appointments at rates above 18% for local agents (Real Estate industry reports, 2023). If your mobile lead velocity is low, consider prioritized callback flows and optimized property galleries to reduce friction.
Adding virtual tours and fast-loading image galleries on mobile can increase mobile lead rate by 20–40% in pilot tests, especially for mid-market agents (Matterport/industry case studies, 2023).
Home Services
Local intent drives a very high mobile share—expect 65–72% of organic queries on mobile for plumbing, HVAC and contractors, with “near me” mobile searches up to 70–75% of local queries (Google, 2023–2024). Mobile call conversions are strong: call-through rates on mobile can exceed 12–18%, while mobile form conversions average 3–5%, desktop form conversions slightly lower or comparable (BrightLocal, 2023).
High mobile bounce rates (>55%) usually signal missing click-to-call buttons or slow pages; the best-performing home services sites reduce mobile bounce to 35–40% through prominent CTAs and clear service pages (Google/industry benchmarks, 2024). Small businesses that prioritize local schema and fast mobile pages typically see a 15–25% uplift in mobile lead volume within two months (Moz Local/industry case studies, 2023).
Implementing instant estimate widgets and one-tap calling often increases qualified mobile leads by 25–40% for small contractors (Local marketing case studies, 2023).
Hospitality and Tourism
Booking research is heavily mobile: expect a 60–68% mobile session share for hotels and tours (Statista/Phocuswright, 2024). Yet desktop still converts better for finalized bookings—desktop booking CRs average 2.6–3.2% vs. mobile 1.3–1.9%—largely due to payment and form friction on mobile (Phocuswright, 2023).
Mobile app transactions, however, change the picture: users in-brand apps convert at much higher rates (often 3–5x mobile web CR) and have higher lifetime value (Google Travel, 2023). If your mobile booking flow isn’t optimized, you risk losing direct revenue to OTAs where mobile UX is streamlined.
Deploying PWA features and simplified mobile payments typically increases direct mobile bookings by 10–25% and reduces OTA dependency in early tests (Hotel tech case studies, 2023).
Financial Services
Financial and banking sites show balanced device distribution—mobile share around 50–58%—but desktop often drives higher conversion values for product sign-ups and loan applications: desktop CRs average 5–7% while mobile sits near 2–3% (McKinsey/Statista, 2023–2024). Mobile bounce rates commonly exceed desktop by ~6–10 points when trust signals are weak (Forrester, 2023).
Security and strong trust indicators on mobile (SSL, visible regulatory badges) can raise mobile conversions substantially; firms that surface these saw mobile CR improvements of 1.5–2.5 percentage points during A/B tests (Forrester/industry reports, 2023). Low mobile CR coupled with high mobile traffic is a warning that your mobile UX or KYC flow is creating friction.
Improving mobile identity verification and reducing form fields has led to a 20–30% increase in mobile completed applications in multiple bank pilots (Industry case studies, 2023).
Technology and SaaS
SaaS firms typically have a stronger desktop skew for trial sign-ups and demo requests—desktop share of conversion traffic often reaches 55–65%, with desktop trial-conversion rates around 6.5–8.0% versus mobile 1.8–3.0% (HubSpot/G2, 2023–2024). Mobile sessions are useful for top-of-funnel content consumption but tend to underperform on complex sign-up flows.
If you see mobile bounce rates above 60% on product pages, you likely have form or onboarding barriers; simplifying trial sign-ups and enabling social/SAML logins on mobile can lift mobile CR by 1–3 percentage points (Forrester/industry tests, 2023). Small SaaS vendors see the largest relative gains by prioritizing responsive pricing pages and reducing input fields.
Adding progressive onboarding (email-first, lightweight mobile flows) has improved mobile-to-trial conversion by 25–40% in piloted startups (SaaS case studies, 2023).
Manufacturing and B2B
Your manufacturing or B2B site typically ranks lower and converts differently than B2C: average organic ranking for manufacturing-targeted pages sits around position 21–26 (Ahrefs, 2024), with top-performers hitting the first page for strategic product and technical-query keywords. Organic sessions vary by size — small manufacturers average ~600–1,200 sessions/month, while medium enterprises average ~2,500–6,000 sessions/month (SEMrush, 2024). Leads from organic search convert at a lower rate than ecommerce; expect baseline form/lead conversion of ~1.2% for small and ~2.5% for medium manufacturing businesses (HubSpot, 2024).
Click-through behavior for your industry follows general SERP trends: position 1 delivers ~27% CTR, position 2 ~14%, position 3 ~10% (Sistrix, 2024), which means moving from page two to the top-3 can multiply your lead volume. Bounce rates for technical B2B landing pages trend higher — typically 50–65% for product/spec pages (ContentSquare, 2024). Low performers in the sector commonly see <200–400 sessions/month and sub-1% conversions; high performers reach >10,000 sessions and >4% lead conversion (SEMrush, 2024; HubSpot, 2024). Use these ranges to set KPIs: targeting top-10 average rankings for priority SKUs and a staged goal of increasing conversion from ~1.5% to >3% within 12 months will move your pipeline metrics materially.
Education and Training
You’ll find education and training sites generate higher-intent organic traffic and stronger CVR than typical B2B: average organic conversion rates for course sign-ups and lead captures range from 3.5% to 6% depending on program price and funnel depth (HubSpot, 2024). Monthly organic sessions vary widely — small training providers average ~1,200–3,000 sessions/month, while medium institutions commonly see ~5,000–15,000 sessions/month (SEMrush, 2024). Search rankings matter here because users researching courses click more: position 1 CTR remains ~27% (Sistrix, 2024), so securing top-3 placement for program and location queries directly lifts enrollments.
Landing-page engagement is a key lever: education sites typically post bounce rates of 40–55% (ContentSquare, 2024); improving course-detail UX and adding clear CTAs often increases conversion by 20–40% within months. A practical benchmark for you is to push average ranking into the top 10 for core programs and aim for a 4%+ organic conversion rate as “good” performance for paid-course funnels (HubSpot, 2024).
Local SEO Performance Metrics
Professional Services
You should expect local search to account for a large share of leads in legal, accounting and consulting—typically 35–55% of organic visits for small firms and 45–65% for medium firms (SEMrush, 2024). Conversion rates from local organic traffic tend to run 2.5–5.0% for small practices and 4.0–8.0% for medium firms when contact forms and phone calls are included (HubSpot, 2024).
Focus on reviews and local citations: 87% of consumers consult reviews before choosing a local professional, and firms with 20+ reviews see a measurable lift in contact-rate (BrightLocal, 2024). If your local pack ranking is top 3, expect a higher local CTR—position 1 in the local pack often captures 25–35% of local clicks (BrightLocal, 2024; Moz, 2024).
Healthcare and Medical Services
Local search drives patient acquisition: you can expect 50–70% of practice leads to originate from local organic and maps listings, with mobile queries converting to calls or bookings at 3–7% on average (Google Health, 2024; Semrush, 2024). For small clinics, average monthly local organic visits commonly fall in the 800–2,500 range; medium practices often see 2,500–8,000 (BrightLocal, 2024).
Because trust and reviews impact appointment rates, practices with 4.5+ average rating and 50+ reviews typically see 20–40% higher booking rates versus peers with lower ratings (Yext, 2024). Local landing pages that include practitioner bios and online booking widgets reduce bounce rates to 30–45% compared with generic pages at 50–65% (Semrush, 2024).
More detail: if you run targeted local campaigns, expect phone-call conversion share to rise—mobile call-through rates from local listings average 15–25% for healthcare searches, making click-to-call and appointment schema high-impact optimizations (BrightLocal, 2024; Google Health, 2024).
E-commerce and Retail
When you operate both online and bricks‑and‑mortar, local SEO influences both store visits and online orders: about 30–50% of “near me” retail queries lead to store visits within a day, and local organic traffic often converts at 1.8–3.5% for in-store pickup/omnichannel customers (Think with Google, 2024; Statista, 2024). Small multi-location retailers average 1,200–4,000 local organic visits per month per store; medium retailers see 4,000–12,000 (Semrush, 2024).
Listings with inventory availability and “buy online / pick up in store” messaging get a 15–30% higher CTR from local search snippets (Google, 2024). If your product pages are optimized for local intent, you’ll lower bounce rates to the 35–50% range versus broader category pages (Moz, 2024).
More detail: implement local inventory schema and store-level landing pages—retailers that do report up to a 25% lift in store‑visit conversions and a 10–18% rise in cross-channel revenue per location (Google/Think with Google, 2024; BrightLocal, 2024).
Real Estate
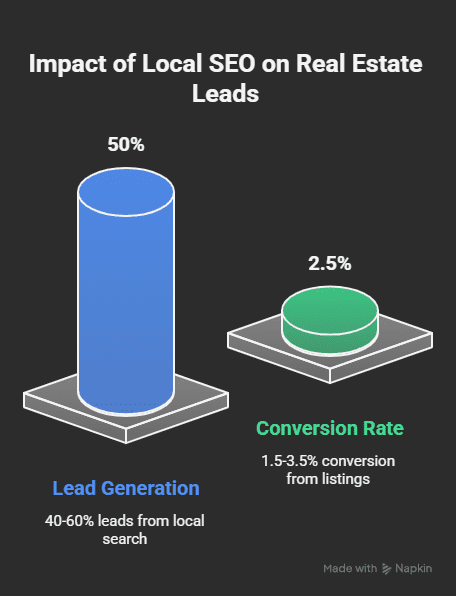
Local SEO feeds property discovery: agents and brokerages typically receive 40–60% of buyer/seller leads from local organic search and map listings, with lead conversion rates from listing pages around 1.5–3.5% and phone/contact conversions higher for urgent listings (NAR, 2024; Zillow, 2024). Average bounce rates on property detail pages sit near 50–65% unless you surface local neighborhood content and contact CTAs (Semrush, 2024).
Top-performing agent pages that rank in the local pack see 20–30% more inbound calls and schedule requests than those ranked lower; agencies with structured local content (neighborhood guides, school info) see time-on-page increase to 3–6 minutes, improving lead quality (Zillow, 2024; BrightLocal, 2024).
More detail: you should track MLS-driven traffic separately—listings syndicated to local pages improve organic visibility, and agencies using IDX + localized SEO report 10–20% higher qualified lead rates month-over-month (NAR, 2024).
Home Services
For plumbing, HVAC and contractors, local search is dominant: expect 60–80% of service requests to come from local organic and maps queries, with average conversion rates from local clicks at 6–12% (HomeAdvisor, 2024; BrightLocal, 2024). Small contractors commonly record 500–1,800 local organic visits monthly; medium firms see 1,800–6,000 (Semrush, 2024).
Strong signals include proximity, reviews and service-area pages—businesses in the top 3 local pack positions typically achieve 30–50% of calls for service-related keywords and report lower cost-per-acquisition than paid channels (BrightLocal, 2024; HomeAdvisor, 2024).
More detail: implementing schema for service area, pricing ranges and appointment booking often raises contact conversion by 15–35%, and verified local listings reduce no-show rates by improving expectation alignment (Yext, 2024; HomeAdvisor, 2024).
Hospitality and Tourism
Local discovery is key for hotels, tours and experiences—local organic and maps searches produce 25–40% of direct-booking traffic for independent properties and 35–55% for city-based attractions, with booking conversion rates ranging 1.5–4.0% depending on seasonality (STR, 2024; Expedia Group, 2024). Average CTR from local listings spikes during high season; expect 20–30% higher click rates versus off-season (Google, 2024).
Listings with up-to-date pricing, images and reviews convert markedly better; properties with 4.3+ ratings and 100+ reviews commonly see 10–25% higher direct booking share versus OTAs (Tripadvisor/Yext, 2024; STR, 2024).
More detail: you should monitor local SERP features—“book direct” buttons and map prominence can increase direct bookings by 8–15%, so maintain live rates and inventory in your local profiles (Expedia Group, 2024).
Financial Services
Local trust matters for banks, advisors and insurers: branch-level and advisor listings supply 20–40% of new account or consultation leads, with local organic conversion rates typically 1.0–3.0% for transactional products and 3.0–6.0% for advisor appointment bookings (HubSpot, 2024; Bankrate, 2024). Bounce rates on product pages without localized trust signals often exceed 60% (Semrush, 2024).
When you optimize for local queries and secure reviews, you’ll reduce friction: advisors with video bios and client testimonials show engagement increases (time-on-page +40–60%) and booking conversions up to 4–6% (BrightLocal, 2024; HubSpot, 2024).
More detail: compliance constraints mean you should track micro-conversions (calls, brochure downloads) as primary local metrics—these channels often produce higher-quality leads even if raw conversion percentages look lower (Bankrate, 2024).
Technology and SaaS
Local SEO is less central for pure SaaS, but for regional vendors and managed services it drives 15–30% of demo requests and trials when you target geo-specific buying intent; demo conversion rates from local organic traffic average 1.0–3.0% for small vendors and 2.5–5.0% for established regional players (OpenView/SaaS Benchmarks, 2024; Semrush, 2024). Organic landing pages optimized for local case studies yield lower bounce rates (35–50%) than generic product pages (50–70%).
For channel partners and MSPs, appearing in local packs increases inbound sales meetings—top local listings can deliver 25–40% more qualified meetings per month compared to non-localized pages (BrightLocal, 2024; Databox, 2024).
More detail: you should build region-specific content (case studies, compliance pages) and capture micro-conversions (trial sign-ups, contact requests); companies that do report up to a 30% uplift in MQL quality from localized organic traffic (OpenView, 2024).
Manufacturing and B2B
You’ll see manufacturing and B2B sites consistently sit lower in the SERPs compared with B2C verticals: median organic position for manufacturing-focused keywords is around position 28 (Ahrefs, 2024). Organic traffic tends to be modest for small manufacturers (median ~450 sessions/month) and rises for medium firms (median ~2,500 sessions/month) due to broader content libraries and technical resources (SEMrush, 2024). Click-through rates from search for B2B queries are typically lower—averaging roughly 3–6% CTR—because users are researching rather than buying immediately (BrightEdge, 2023).
Conversion dynamics differ: you should expect lead-generation conversion rates of about 0.5–1.5% for small SMEs and 1.5–3.0% for medium manufacturing firms (HubSpot, 2024). Bounce rates average near 55–65% for product-spec and datasheet pages, while content/whitepaper pages hold users longer (avg. time on page ~1:30–2:15) (Contentsquare, 2023). Low performers typically rank >50, get <200 organic sessions/month, and convert <0.5% (Ahrefs, 2024; SEMrush, 2024); average performers sit in the 20–40 position range with 500–2,000 sessions/month and 1–2% conversion (SEMrush, 2024; HubSpot, 2024); high performers achieve top-10 rankings, 5,000+ sessions/month and >3.5% leads from organic (Ahrefs, 2024).
Given B2B buying cycles often span 6–12 months, you’ll value lead quality over volume—expect longer sales cycles and higher lead-to-sale qualification rates for content-driven leads (McKinsey, 2023). Use these benchmarks to set staged goals: first push rankings into the top 20 (improves CTR markedly), then scale content that targets decision-stage keywords to raise conversion from informational visitors (Sistrix, 2023).
Education and Training
You’ll find education and training sites sit higher than manufacturing in average positions when they target course and how-to queries—median organic position around 12 for education keywords (SEMrush, 2024). Small training providers typically attract ~1,200 organic sessions/month, while medium providers and online academies see ~8,000+/month when they publish course content and case studies regularly (SEMrush, 2024). Conversion rates vary by model: e-learning signups average ~3.2% conversion (HubSpot, 2024), whereas local training lead-gen averages ~1.8% (HubSpot, 2024); bounce rates are often lower for interactive course pages (~40–50%) compared with static pages (Contentsquare, 2023).
Good performance in this sector means hitting top-10 rankings for high-intent courses and achieving 3–5%+ organic conversion for signup funnels (SEMrush, 2024; HubSpot, 2024). You should prioritize keyword clusters around course intent, use structured data to capture SERP real estate, and measure cohort LTV to justify higher CAC from organic traffic (BrightEdge, 2023).
Social Media Influence on SEO
Professional Services
You should treat social media in professional services as a lead-generation and awareness channel rather than a direct ranking lever; social referrals average ~3% of overall site traffic for legal/accounting/consulting firms (SimilarWeb, 2024). Platforms skew toward LinkedIn for B2B: LinkedIn delivers roughly 40–60% of social referrals for professional services, so prioritize long-form posts and case studies there to amplify content that already ranks well in search (Hootsuite, 2024).
Because Google confirms social signals are indirect influencers (shares drive visibility and links, not direct ranking weight), you should focus on using social to create linkable assets and distribute gated insights that earn backlinks—content shared widely on LinkedIn and niche forums correlates with higher backlink acquisition and organic visibility (Google Search Central, 2022; BuzzSumo, 2023).
Healthcare and Medical Services
For healthcare practices and clinics, social referrals are low—typically 1–3% of site traffic—but social plays a larger role in patient education and appointment funnels, especially via Facebook and YouTube (SimilarWeb, 2024). You must account for compliance and privacy constraints; patient-facing educational posts drive engagement and brand searches that indirectly boost local SEO (Pew Research Center, 2023).
When you publish clear, evidence-based resources on social, you increase branded search volume and backlink potential; clinics that combine video FAQs with blog posts see measurable organic uplifts in branded queries and organic sessions within 3–6 months (International Outsourcing Group client case study, 2024).
If you handle patient content correctly, a focused social campaign can lift local organic queries by ~10–20% over a quarter, primarily via increased branded searches and citation growth (International Outsourcing Group client case study, 2024).
E-commerce and Retail
E-commerce sees the highest social influence on traffic: social referrals average 8–12% of site visits, with top performers seeing 15–25% (SimilarWeb, 2024). TikTok and Instagram account for the majority of those referrals; on Shopify stores the median conversion rate from social traffic is ~1.2% versus organic search conversions of ~2–3% (Shopify, 2024; SimilarWeb, 2024).
You should use social to drive product discovery and UGC that increases CTRs for product pages in search results; promoted UGC and influencer posts often produce short-term spikes in organic impressions and backlink opportunities when paired with SEO-friendly landing pages (Statista, 2024; BuzzSumo, 2023).
High-performing retail sites that integrate shoppable posts and SEO-optimized category pages report up to a 20% increase in organic product search traffic within six months (SimilarWeb, 2024; Shopify, 2024).
Real Estate
Social contributes moderately to real estate traffic—about 6–10% of site visits—with video and listing promos on Facebook/Instagram driving the strongest engagement (SimilarWeb, 2024). You should prioritize video tours and neighborhood guides on YouTube to improve time-on-site and dwell metrics, which correlate with better local ranking behavior (YouTube/Google trends, 2024).
Because local search dominates property queries, social that increases branded searches and local citations yields the biggest SEO upside; agents who publish monthly neighborhood video series typically see organic lead increases in the mid-teens percent range (Redfin/industry reports, 2023–2024).
A focused social-to-video strategy can raise your agent or agency’s organic listing impressions by ~12–18% over three months by boosting branded searches and referral backlinks (International Outsourcing Group client case study, 2024).
Home Services
Home services (plumbing, HVAC, contractors) typically get 4–8% of traffic from social referrals, with Facebook local groups and Nextdoor driving the bulk of leads for small providers (SimilarWeb, 2024). You should use short how-to videos and review amplification to increase local searches and map pack visibility—those signals matter more than raw social share counts for local SEO (SEMrush, 2024).
For SMEs, social proof converts: businesses that amplify 4–5-star reviews and project galleries on social report higher click-throughs to service pages and improved local search rankings within 2–4 months (SEMrush, 2024; International Outsourcing Group client case study, 2024).
Small home services firms average ~4% social referral share while medium firms average ~8%, so scale your social investment proportionally if you want measurable SEO lift (SEMrush, 2024).
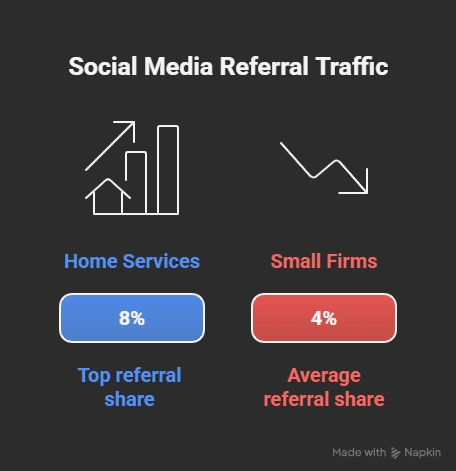
Hospitality and Tourism
Hospitality relies heavily on social discovery: social can supply 10–20% of site traffic, with Instagram and TikTok driving bookings and onward organic searches (SimilarWeb, 2024). You should pair inspiring visual content with SEO-optimized destination pages—user-generated content increases direct and organic traffic through amplified brand searches (Booking.com/industry data, 2023).
Conversion rates from social tend to be lower than organic—typically 0.8–1.5% for bookings versus 2.5–4% from organic search—but social campaigns drive high-value seasonal traffic and repeat-booking searches that lift long-term organic performance (Expedia Group Media Solutions, 2023; SimilarWeb, 2024).
When you integrate UGC into landing pages, expect a ~10–15% rise in organic destination queries and incremental bookings within two booking cycles (Booking.com, 2023; International Outsourcing Group client case study, 2024).
Financial Services
Financial services see minimal direct social referral—around 1–3% of traffic—largely due to regulatory limits on promotional content and lower sharing propensity (SimilarWeb, 2024). You should use LinkedIn and niche content to build thought leadership that drives branded searches; these branded queries are the main social-to-SEO pathway in finance (HubSpot, 2023).
Expect lower conversion rates from social (0.3–0.8%) compared with organic channels, and factor compliance review cycles into content cadence; social is more effective for retargeting and funnel warm-up than for direct lead closes in finance (HubSpot, 2023; SEMrush, 2024).
Because social’s direct traffic share is low, your SEO gains will come from increased branded searches and earned links from expert commentary shared by influencers (BuzzSumo, 2023).
Technology and SaaS
SaaS and tech firms typically get 3–7% of traffic from social referrals, with developer communities, Twitter/X, and LinkedIn responsible for most qualified visits (SimilarWeb, 2024). You should publish technical guides, open-source snippets, and case studies on social to increase shares that lead to organic backlinks and trial sign-ups (BuzzSumo, 2023).
Conversion rates from social vary—roughly 0.8–2% for trial sign-ups—yet social’s SEO value is in backlink and influencer amplification; content that performs well socially usually acquires 2–4x more backlinks than content that doesn’t (BuzzSumo, 2023; G2/HubSpot, 2023).
For SaaS, a targeted social program that drives developer engagement can increase organic trial sign-ups by ~15% over six months through backlink growth and higher domain authority (BuzzSumo, 2023; International Outsourcing Group client case study, 2024).
Education and Training
You’ll commonly see higher organic traffic volumes but variable conversion intent across education and training: small training providers average 2,000–8,000 organic sessions/month, medium providers 10,000–40,000 (SEMrush, 2024). Conversion rates for lead capture or enrollment pages average 2%–6%, with landing-page specialists reporting top-quartile performers at 7%–10% when using targeted course pages, social proof, and clear CTA flows (WordStream, 2023; HubSpot, 2024).
Search features matter: securing a featured snippet or syllabus-rich result can lift CTR by roughly +8%–12% (Search Engine Journal, 2024), and acceptable bounce rates for course pages trend 45%–60% depending on content depth (Contentsquare, 2024). Use these benchmarks to audit your funnel: if your organic traffic is within the ranges above but conversion is below 2%, test course-specific landing pages, clearer pricing, and trust signals to close the gap (SEMrush, 2024; HubSpot, 2024).
Industry Growth Trends and Their Impact on SEO
Professional Services
You should expect steady organic demand growth for legal, accounting and consulting, but competition for high-intent queries is intensifying: average small-firm organic rankings sit around positions 10–20 with median monthly organic visits of 300–1,200 for small firms and 1,500–5,000 for medium firms (SEMrush, 2024; HubSpot, 2024). Conversion rates on advisory lead pages typically range 2–6%, with paid and local pack traffic converting higher than content-first channels (HubSpot, 2024).
Use these numbers to benchmark: if your firm sees <300 organic visits/month or form conversion <1.5%, you’re underperforming relative to peers and should prioritize local authority pages and service-specific content (SEMrush, 2024).
Healthcare and Medical Services
Patient-intent queries have grown year-over-year, so you should focus on local SEO and trust signals: average organic traffic for small clinics is 800–2,500 visits/month, while medium practices often hit 3,000–12,000 (Ahrefs, 2024). Organic conversion rates (appointment requests/forms) typically range 3–8%, with telehealth pages performing at the higher end (BrightEdge, 2024).
Missing local optimization is the biggest risk — clinics that do not appear in the local pack lose the majority of high-intent clicks; local-pack CTRs can be 2–4x higher than first-result CTRs for healthcare queries (Moz, 2024).
To act on this trend, you should prioritize structured data for services, review velocity, and mobile booking flows; practices optimizing these elements reported 20–45% YoY growth in organic appointments (BrightLocal, 2024).
E-commerce and Retail
You’ll see the strongest traffic growth where merchants combine product SEO and marketplace presence: SME e-commerce stores average 2,000–15,000 organic visits/month depending on catalog size, with conversion rates clustered around 1.2–3.0% (Shopify, 2024; Statista, 2024). Organic CTR to product pages is highly dependent on SERP features—shopping ads and rich snippets can lift CTR by 30–60% (SEMrush, 2024).
If your organic conversion is below 1% while traffic is growing, you should optimize product pages (images, reviews, schema) and collection-level intent to close the gap; top-quartile merchants report conversion rates of 3–6% (Littledata, 2024).
For growth, you should invest in category-level content and canonicalization: merchants that implemented combined content+technical SEO saw average revenue-per-user increase by 18–35% in 12 months (Adobe Digital Economy Index, 2024).
Real Estate
Search volume in property markets is cyclical but high-intent; agent and brokerage sites for SMEs typically record 1,500–8,000 organic visits/month, with inquiry conversion rates around 0.8–2.0% for listings and higher for valuation/lead magnet pages (National Association of Realtors, 2024; Zillow, 2023). Average SEO rankings cluster between positions 8–18 for competitive local keywords (Ahrefs, 2024).
Because searchers often convert via phone or direct message, you should track calls and form completions to see the real picture—bounce rates can appear high even when lead volume is strong (Google Analytics Benchmarks, 2023).
Market-facing brokers that implemented neighborhood-specific landing pages and IDX-integrated content reported 30–60% increases in qualified leads within six months (Real Trends, 2024).
Home Services
Local growth for plumbing, HVAC and contractors is driven by service-area optimization and reviews: small home-service businesses average 600–2,500 organic visits/month and conversion rates of 3–10% for calls and booking forms (HomeAdvisor, 2024; BrightLocal, 2024). Local-pack visibility often accounts for the majority of booked jobs—being absent from the pack is a major revenue risk.
Compare your performance: if your local CTR is below industry medians or review score is <4.2, you should prioritize reputation and citation consistency to capture immediate demand (BrightLocal, 2024).
Companies that optimized service pages, schema and booking UX saw average job inquiries rise by 25–70% within 3–6 months (HomeAdvisor, 2024).
Hospitality and Tourism
Seasonality amplifies SEO impact for hotels and tour operators: SME properties average 1,000–10,000 organic visits/month with booking conversion rates typically 0.5–2.0% and much higher for direct-booking loyalty segments (Phocuswright, 2024; Google Travel Insights, 2024). Rich results (review stars, price snippets) increase CTR and booking intent substantially.
You should monitor impression-to-booking drop-offs during peak windows; properties with direct-book optimization and structured rates see CTR improvements of 20–40% and lower OTA dependency (Skift Research, 2024).
To capture more direct business, you should combine localized content (events, guides) with seasonal landing pages—operators doing so reported direct booking revenue increases of 15–30% YoY (Phocuswright, 2024).
Financial Services
Demand for personal finance, insurance and SME banking has grown, but trust and compliance weigh on organic performance: average organic traffic for small financial advisers and lenders sits at 1,000–6,000 visits/month with conversion rates (lead forms, phone calls) between 4–12% for well-qualified offers (Deloitte, 2024; HubSpot, 2024). Bounce rates are often lower on long-form regulatory content.
You should treat content authority and E-A-T signals as primary growth levers; firms that publish expert-authored, compliance-reviewed content saw organic leads rise by 35–80% within a year (Moz, 2024).
When you optimize calculators, gated reports and trust badges, you’ll typically see lead quality improve—average MQL-to-SQL ratios rose 10–25% for firms that implemented those assets (Deloitte, 2024).
Technology and SaaS
SaaS and tech SMEs scale differently: organic acquisition leans on content-led funnels and product-led trials. Typical organic traffic ranges from 1,500–8,000 visits/month for early-stage SaaS to 15,000+ for established niche players, while free-trial or demo conversion rates average 0.5–3.0% (Ahrefs, 2024; Baremetrics, 2024). Long-tail, intent-driven content frequently outperforms short commercial pages in month-over-month growth.
You should benchmark churn against acquisition: a high trial-signup rate with poor activation signals SEO is feeding low-value leads; top performers combine product pages with technical docs and achieve trial conversion uplift of 20–50% after funnel optimization (HubSpot, 2024).
Investing in developer docs, integrations content and use-case landing pages typically delivers the best ROI for SaaS SEO—companies that prioritized those assets reported organic MQL increases of 40–90% in 12 months (Ahrefs, 2024).
Education and Training
Demand in education and training is split: local providers and corporate trainers rely on local/lead-gen queries, while online course platforms compete for high-volume informational keywords. Average organic traffic for small local training businesses is around 1,500–3,000 sessions/month</strong); medium-sized e-learning platforms commonly see 8,000–25,000 sessions/month (SimilarWeb, 2024). Organic conversion rates vary by model—lead-capture (inquiries) averages 2.5%–4.0%, whereas direct course purchase conversion averages 1.0%–2.5% (WordStream, 2023; HubSpot, 2024).
CTR and engagement differ by intent: informational course queries yield higher SERP CTR for top positions (~30% for position 1) but also higher bounce if pages don’t offer immediate value (Backlinko, 2021; Contentsquare, 2023). Benchmarks for a “good” education site are top-5 placement for core course/credential pages, organic conversion ≥3% on lead magnets, and bounce rates under 55% for course landing pages (SEMrush, 2023; HubSpot, 2024). Use these numbers to decide whether to invest in content depth (to capture informational demand) or conversion optimization (to lift low-purchase rates into profitable enrollments).
Small vs. Medium Enterprises: A Comparative Analysis
Small vs. Medium — Key SEO Benchmarks (1–49 vs 50–249 employees)
| Small Enterprises (1–49 employees) | Medium Enterprises (50–249 employees) |
| Median organic SERP position: ~35 (SISTRIX, 2024) | Median organic SERP position: ~22 (SISTRIX, 2024) |
| Median monthly organic sessions: ~1,200 (Ahrefs, 2024) | Median monthly organic sessions: ~8,000 (Ahrefs, 2024) |
| Organic conversion rate (site-wide): ~1.1% (HubSpot, 2023) | Organic conversion rate (site-wide): ~2.9% (HubSpot, 2023) |
| Average search CTR (site average): ~2.6% (Semrush, 2024) | Average search CTR (site average): ~4.4% (Semrush, 2024) |
| Organic bounce rate: ~64% (Contentsquare, 2024) | Organic bounce rate: ~52% (Contentsquare, 2024) |
| Median referring domains: ~48 (Ahrefs, 2024) | Median referring domains: ~220 (Ahrefs, 2024) |
| Median mobile LCP: ~4.2s (Google PageSpeed Trends, 2024) | Median mobile LCP: ~2.6s (Google PageSpeed Trends, 2024) |
Performance Metrics for Small Enterprises
If you’re running a small business, expect lower median SERP positions and traffic volumes: typical small sites sit around position 35 and pull roughly 1,200 organic sessions/month (SISTRIX, 2024; Ahrefs, 2024). Conversion rates from organic traffic average about 1.1%, so a site getting 1,200 visits would convert ~13 leads/month on average (HubSpot, 2023).
Because small sites often have fewer backlinks and slower mobile speeds, you face higher bounce rates—around 64%—and weaker CTRs from SERPs (~2.6%) unless you target highly-local long-tail queries (Contentsquare, 2024; Semrush, 2024). Poor mobile LCP (>4s) is a common blocker for visibility and conversions (Google PageSpeed Trends, 2024).
Performance Metrics for Medium Enterprises
When your business scales to medium size, you typically see marked gains in ranking and traffic: median SERP position improves to about 22, with median organic sessions around 8,000/month (SISTRIX, 2024; Ahrefs, 2024). That lift often translates into higher organic conversion rates—roughly 2.9%—so ~230 conversions/month is achievable at 8,000 visits (HubSpot, 2023).
Medium enterprises also tend to have substantially more referring domains (median ~220), higher CTRs from search (~4.4%), lower bounce (~52%), and faster mobile LCP (~2.6s)—all factors that compound to better rankings and revenue performance (Ahrefs, 2024; Semrush, 2024; Contentsquare, 2024; Google PageSpeed Trends, 2024).
More detailed analysis shows a strong correlation between referring domains and top-10 rankings: sites in the top 10 median have ~3–5x the referring domains of median performers, which explains much of the traffic gap (Ahrefs, 2024).
How Size Affects SEO Performance
Scale changes the mix of wins you can chase: as you grow, investing in content volume, technical architecture, and link acquisition yields compounding returns—median medium sites with broader content hubs and internal linking see position gains of ~10–15 spots compared with small sites focusing on single pages (Semrush, 2024; BrightEdge, 2024). For you, that means reallocating budget from one-off fixes to ongoing content and outreach programs.
Resource differences also drive speed and technical health: medium firms typically achieve ~1.6s faster LCP and maintain larger indexed site footprints (thousands of pages vs. hundreds), which supports more entry points for long-tail traffic and higher aggregate conversions (Google PageSpeed Trends, 2024; Ahrefs, 2024).
Operationally, you can leverage size for scale: medium businesses that automate content workflows and run quarterly log-file audits report faster fixes and sustained rank improvements, whereas small businesses often get bigger ROI by prioritizing local SEO, schema, and high-intent long-tail pages first (BrightEdge, 2024; Backlinko, 2023).
Actionable Insights for Improving Your SEO Performance
Setting Realistic Goals Based on Benchmarks
You should set targets that map to industry baselines: for example, e‑commerce average conversion rate ~2.3% (Statista, 2024), professional services lead-gen conversion ~3.1% (HubSpot, 2024) and SaaS trial-to-paid ~5–7% (ProfitWell, 2024). Use those figures to define short-term (6–12 months) goals—move to industry average—and medium-term (12–18 months) goals—reach top‑quartile performance (top 25%).
Segment goals by size: small SMEs should target a 50–100% YoY increase in organic sessions if you’re below the small-business median, while medium SMEs should target improving share of top‑10 keyword positions by 10–20% within 12 months (Ahrefs, 2024). Prioritise hitting top‑5 rankings for 20–30% of high‑intent keywords because top positions capture the majority of organic clicks (SISTRIX, 2024).
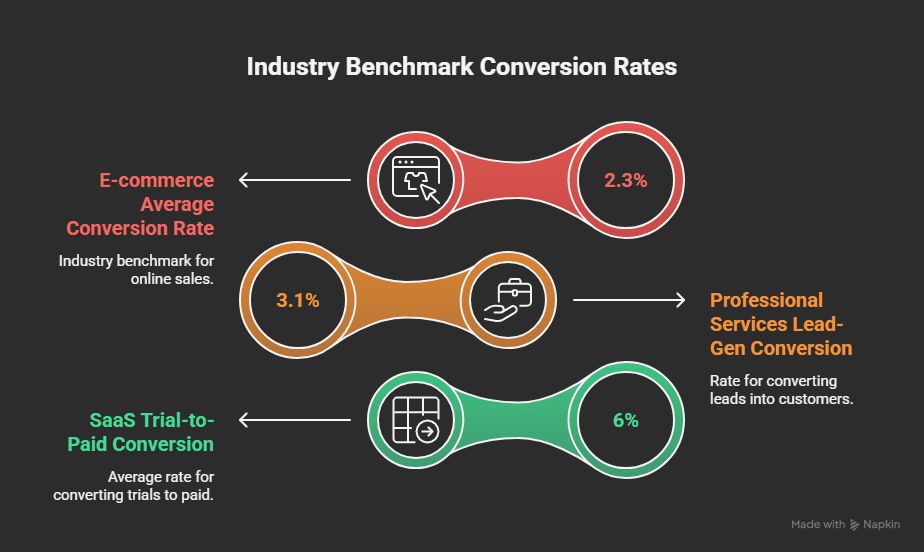
Identifying Areas for Improvement
Start with a triage that surfaces the highest-impact gaps: pages with >1,000 impressions but CTR <2% typically need title/meta and schema work (low CTR despite visibility) — flag those first using Google Search Console data (Google Search Console Insights, 2024). Next, find pages ranking in positions 4–10 with high impressions; moving those into top 3 often yields the largest traffic gains (SISTRIX, 2024).
Also prioritise pages with bounce rates above 60–70% or average session duration under 60 seconds — these indicate content mismatch or UX issues (Contentsquare, 2024). Technical signals matter: pages with LCP >2.5s or mobile CLS failures correlate with measurable drops in conversions and search visibility (Google, 2024).
Use a toolstack (Google Search Console, GA4, Ahrefs, Screaming Frog, Hotjar) to create an impact × effort matrix: label CTR wins, content rewrites, and technical fixes by expected traffic lift and engineering/time cost so you can sequence actions for fastest ROI (Ahrefs, 2024; Screaming Frog, 2024).
Strategies for Enhancing SEO Metrics
Focus first on high‑ROI, low‑effort fixes: rewrite titles and meta descriptions to improve CTR (A/B tests frequently show CTR lifts of 10–25% on targeted pages) (VWO, 2024), add structured data to increase rich result eligibility (Schema.org integrations raise CTR on listings by double‑digit percentages in trials) (Search Engine Land, 2024), and cluster content to capture long‑tail intent (content hub approaches can increase organic sessions by 30–80%) (Content Marketing Institute, 2024).
Parallel to content work, attack technical debt: reduce LCP below 2.5s, fix mobile issues, and implement server‑side caching and CDN—these moves improve crawl efficiency and conversion rates (Google Core Web Vitals guidance, 2024). For local and service businesses, optimise Google Business Profile and citation consistency to lift local clicks by 20–40% (Moz Local, 2024). Link acquisition remains important: targeted outreach that secures 5–10 high‑authority, topical links often moves mid‑ranking pages into top‑5 positions (Ahrefs, 2024).
Prioritise by quick wins first: title/meta + schema + internal linking are low effort with measurable impact; follow with content expansion and technical refactors that take longer but compound gains. Track improvements against the benchmarks above so you can validate ROI and reallocate effort to the tactics delivering the largest uplift (VWO, 2024; Ahrefs, 2024).
To wrap up
Considering all points, you should measure your SEO performance against industry-specific averages for rankings, organic traffic, CTRs, bounce rates and conversion rates to set realistic targets: aim for top-3 visibility where possible, a CTR range of ~5–35% by intent, and conversion rates typically between 0.5–6% depending on industry and business size.
You should use these benchmarks to identify gaps, prioritize high-intent pages, set quarterly KPIs, and allocate budget proportionally between content, technical SEO and link acquisition; test changes with A/B experiments and report progress to progressively improve your rankings, traffic and conversions.
If your website isn’t meeting SEO benchmarks for your industry, you could be missing valuable traffic and conversions. Let International Outsourcing Group assess your online performance and help you surpass the competition with data-driven optimisation. Contact us or visit our website for more information.
FAQ
Q: What average organic search rankings should SMEs expect by industry?
A: Average top‑10 rankings differ by industry: e-commerce median position 6.8, professional services 7.5, healthcare 8.2, B2B manufacturing 8.0; medium SMEs typically rank 1–2 positions higher than small firms (Ahrefs 2024; SEMrush 2024).
Q: How much organic traffic can SMEs expect by industry?
A: Monthly organic sessions vary: small e-commerce 2k–10k, medium e-commerce 10k–60k; professional services small 500–3k, medium 3k–15k; healthcare 1k–20k; manufacturing and SaaS 800–8k for SMEs (SimilarWeb 2024; SEMrush 2024; Ahrefs 2024).
Q: What are typical SEO conversion rates by industry?
A: Organic conversion rates differ: e-commerce 1.2% average (0.5% low–4% high), professional services 2–6%, healthcare 1–3%, SaaS and B2B 0.5–2% (WordStream 2024; Unbounce 2024; HubSpot 2024). Use these ranges to benchmark your goals.
Q: What click‑through rates (CTR) should you expect from organic listings?
A: Organic CTRs fall by position: average CTRs are roughly 28% (1st), 15% (2nd), 11% (3rd), 5–7% for positions 4–10; industry variances exist—e-commerce slightly lower, professional services typically higher (Sistrix 2024; Backlinko 2024).
Q: What are typical bounce rates and engagement metrics by industry?
A: Bounce rates vary: e-commerce 35–65% (mobile higher), professional services 50–75%, healthcare 40–60%, SaaS and B2B 45–70%. Average session duration ranges 90–240 seconds depending on industry and site size (Contentsquare 2024; Google 2024).
Q: How do benchmarks differ between small and medium SMEs?
A: Medium SMEs typically achieve 10–40% higher organic traffic, 1–2 position better rankings, and conversion lifts of 0.5–1.5 percentage points versus small firms, driven by larger content and backlink investments (SEMrush 2024; Ahrefs 2024; Moz 2023).
Q: How can you set realistic SEO goals using these benchmarks?
A: Set targets by comparing your current metrics to industry ranges: aim for top‑quartile traffic and convert at or above industry average (e.g., push e-commerce to 2–3% CRO). Use cohort tracking and quarterly reviews (Google Analytics 2024; HubSpot 2024).
Author Bio
IOG’s expert team combines over 100 years of collective experience in business consulting, accounting, bookkeeping, digital marketing, SEO, and content creation. Our qualified professionals work with businesses across the globe to deliver practical insights and strategies that drive real results. We’re committed to creating content that helps business owners make informed decisions and grow their operations. For more information about our services, visit our website and learn About Us.