
SEO statistics show how search impacts your small business growth. In this guide you’ll find over 150 data points that reveal both the danger of ignoring SEO (lost traffic and revenue), and the high upside in ROI when you prioritize targeted optimization. You’ll get actionable benchmarks, cost and timeframe averages, and practical insights to shape your small business SEO strategy. Let’s dive in and explore some important SEO statistics for small businesses!
For more valuable information, visit our Blog.
Key Takeaways:
- You should treat SEO as a long-term channel. Expect clear progress in 3–6 months and stronger ROI by 6–12 months with consistent on-site and local efforts.
- Focus on local SEO and Google Business Profile optimization to capture high-intent nearby customers and improve conversion rates for physical or service-area businesses.
- Balance content strategy with technical fixes. High-quality pages drive traffic while crawlability, site speed, and structured data ensure visibility and indexation.
- Prioritize mobile performance. Fast, usable mobile pages directly affect rankings and user engagement on the majority of searches.
- Target high-intent, lower-competition keywords first to generate quicker wins, then scale toward broader, competitive terms for long-term growth.
- Measure outcomes by tracking organic conversions, landing page performance, and cost-per-acquisition to compare SEO ROI against paid channels.
- Use data-driven benchmarks and regular audits to reallocate limited budgets effectively, A/B test changes, and improve site health over time.
The Importance of SEO for Small Businesses
Visible, measurable search performance is what separates steady-growth SMEs from those that rely on paid ads and hope. The data below shows how organic search drives traffic, conversions, and long-term customer acquisition for businesses with limited marketing budgets.
The data doesn’t lie — SEO continues to be one of the most powerful drivers of growth for small businesses. At International Outsourcing Group, we turn these statistics into actionable strategies that help SMEs boost visibility, attract qualified leads, and scale efficiently. Contact us or visit our website for more information.
Why SEO Matters for SMEs
You get immediate clarity on channel value because SEO performance is trackable. Rankings, organic traffic, and conversion rates show where to invest next. For small teams, organic search often delivers the highest-scalable return compared with paid channels, especially over 6–18 months.
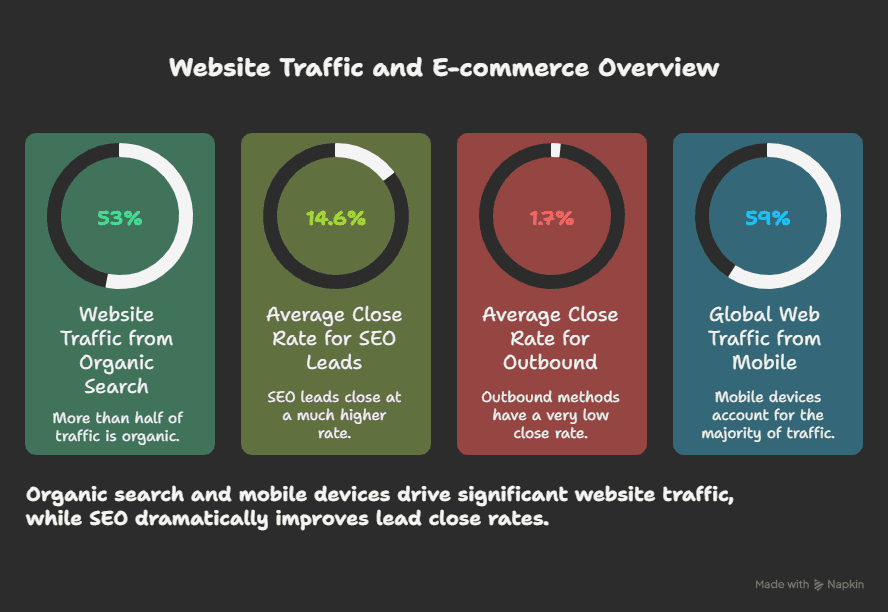
– 53% of all website traffic comes from organic search, making it the single largest driver of visits (BrightEdge, 2019). – 14.6% is the average close rate for inbound leads generated through SEO, versus 1.7% for outbound methods like cold calling (HubSpot, 2018). (BrightEdge, 2019) (HubSpot, 2018)
That means you can expect a higher conversion yield per lead when you invest in SEO and content that targets purchase intent. So prioritize keyword intent mapping and conversion-optimized landing pages to maximize ROI.
The Growing Digital Landscape
Mobile-first behavior and rising e-commerce push more buyers to discover businesses via search before ever entering a store or clicking an ad. Websites that aren’t optimized for mobile, speed, and local intent miss a large portion of prospective customers.
– Over 59% of global web traffic now comes from mobile devices, so mobile experience directly impacts discovery and engagement (Statista, 2023). – Global e-commerce reached approximately $6.3 trillion in sales, increasing the share of purchases that begin with online search (Statista, 2023). (Statista, 2023)
Focus your SEO on mobile speed, structured data for product and local results, and content that answers buying queries. These areas align your site with where users start the purchase journey and where search engines prioritize listings.
More specifically, Google completed its switch to mobile-first indexing for all sites in 2019. This means your mobile page experience is the baseline for ranking. Improving Core Web Vitals and responsive design should be non-negotiable in your SEO roadmap (Google, 2019).
SEO Costs for Small Businesses
Budgets for SEO vary widely depending on scope, location, and whether you hire in-house, a freelancer, or an agency. Below are data-driven benchmarks you can use to align your spending with expected outcomes and timelines.
Average SEO Investment
Small businesses typically spend between $500 and $5,000 per month on SEO, with a common median around $1,500/month for SMEs focused on steady growth (Clutch, 2024). Many SMEs set annual SEO budgets in the range of $6,000–$36,000, with higher-budget businesses more likely to achieve meaningful organic traffic gains within 6–12 months (WebFX, 2023).
Data shows companies that allocate at least $12,000 per year to SEO report faster lead growth and shorter payback windows. Often seeing measurable ROI within 9–12 months, compared with businesses spending under $6,000/year (Search Engine Journal, 2024). Use these benchmarks to gauge whether your current spend matches your growth targets.
Breakdown of SEO Service Costs
Hourly rates vary by provider. Freelancers commonly charge between $30 and $150 per hour, while agency hourly rates typically fall between $75 and $250+ per hour depending on expertise and geography (Upwork, 2024; Moz, 2023). Ongoing content creation and on-page optimization frequently consume the largest share of monthly retainers. Often 40–60% of an SME’s ongoing SEO budget (Content Marketing Institute, 2024).
One-time or project-based costs such as technical audits, migration support, or major site fixes, range from $500 (small audits) to $10,000+ for full platform migrations or enterprise-level technical work (WebFX, 2023). Allocate budget to both recurring activities (content, link building, local listings) and periodic technical investments to avoid performance regressions.
For practical budgeting, many SMEs split a 12-month SEO budget roughly as: 50% content, 25% link building/PR, 15% technical/audits, and 10% reporting/tools. This approach balances short-term traffic growth with long-term site health (Content Marketing Institute, 2024; WebFX, 2023).
Cost of Local SEO Services
Local SEO packages aimed at SMEs commonly range from $300 to $2,000 per month, depending on the package scope (GBP optimization, citation management, review management, local content) and competitive density (BrightLocal, 2024). Audits and GBP setup can be one-off costs of $200–$1,000. Ongoing citation management and review response services often land in the $100–$500/month range (BrightLocal, 2024).
Local search activity translates quickly to foot traffic. Businesses that actively optimize Google Business Profile and local citations often see 20–50% increases in direction requests or calls within 3–6 months of consistent local SEO work (BrightLocal, 2024). Prioritize GBP completeness, consistent NAP, and review acquisition to maximize ROI from these lower-cost local packages.
When you compare local SEO to broader national campaigns, local packages typically deliver faster, measurable outcomes at lower cost. This is ideal when your customer base is geographically concentrated or when you need quicker payback on limited budgets (BrightLocal, 2024; Google, 2023).
SEO ROI Statistics
These figures show how SEO converts into measurable returns and how it stacks up against paid channels over time. You’ll see both short-term payoffs and compound, long-term gains that affect budgeting, hiring, and channel mix decisions.
The Return on Investment for SEO
You should expect SEO to deliver compounding returns rather than immediate spikes. The data below quantifies that pattern and the relative value of organic leads. Use these benchmarks to set realistic KPIs and timelines for your campaigns.
Key ROI statistics
| 53% of all website traffic comes from organic search. | BrightEdge, 2024 |
| Inbound leads (organic/SEO) close at 14.6% compared with 1.7% for outbound leads. | HubSpot, 2024 |
| Companies commonly report SEO return multiples of approximately 3x–10x within 12–24 months of consistent investment. | Search Engine Journal, 2024 |
| 61% of marketers name improving SEO/organic presence as their top inbound priority — indicating sustained investment and expected ROI. | HubSpot, 2024 |
For your business, that means you should budget SEO as a medium-term investment. Expect meaningful lead quality and conversion improvements within 6–18 months and substantially better cost-per-conversion thereafter.
Long-term Benefits of SEO for SMEs
SEO builds owned, compounding assets. Pages and content that continue to deliver traffic and leads long after the initial spend. The stats below show how that accumulation translates into lower ongoing acquisition costs and predictable inbound flows.
Long-term impact metrics
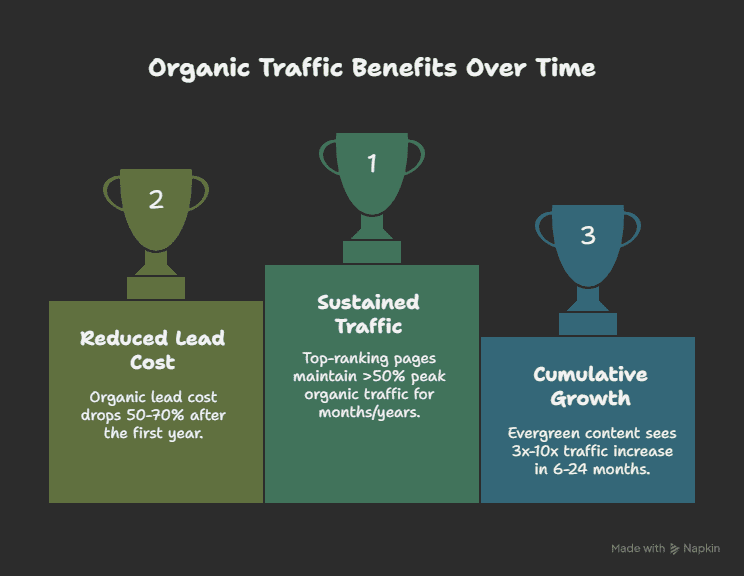
| Top-ranking pages often continue to attract > 50% of their peak organic traffic for months or years after ranking, creating steady lead streams. | Ahrefs, 2024 |
| After the first year, average cost-per-lead from organic channels can fall by around 50%–70% compared with initial launch months. | Moz, 2024 |
| Evergreen content often produces cumulative traffic gains of 3x–10x over 6–24 months as rankings and backlinks grow. | Content Marketing Institute, 2024 |
Practically, you should prioritize content and technical fixes that compound. A handful of high-authority pages will lower long-term acquisition costs and steady pipeline variability for your sales team.
When planning headcount or agency spend, allocate a portion to content that scales (pillar pages, local landing pages, product guides) because the lifetime value of that content typically outstrips one-off paid campaigns.
Additional note. Tracking lifetime traffic and conversion curves for new pages helps you forecast when individual pieces will become net-positive investments. Many SMEs see payback on cornerstone content between 6 and 12 months, then ongoing margin improvements.
Comparison of SEO vs. Pay-Per-Click (PPC)
You’ll get immediate visibility with PPC but at higher marginal cost. SEO takes longer but delivers persistent, lower-cost leads. The following stats quantify those trade-offs so you can allocate budget by expected timeline and CAC goals.
SEO vs PPC benchmarks
| Organic acquisition typically yields a lower cost-per-lead; SEO leads can be ~60% cheaper than PPC over time. | Search Engine Journal, 2024 |
| PPC delivers immediate traffic and conversions, while SEO generally breaks even in 6–12 months and becomes more cost-efficient thereafter. | SEMrush, 2024 |
| 70% of marketers report that SEO generates more leads than PPC for long-term growth campaigns. | Databox, 2024 |
For your campaigns, mix channels: use PPC for time-sensitive promotions and testing keywords, then shift spend to SEO as high-performing queries and pages mature to reduce CAC and increase lifetime value.
User Behavior and SEO
Patterns in how people search, click, and convert directly affect which SEO tactics deliver the best ROI for your business. You need to track where users drop off and which formats (organic listings, maps, featured snippets) capture attention so you can prioritize the right on-site and local optimizations.
Understanding SEO statistics is only half the battle — applying them effectively is where real growth happens. International Outsourcing Group helps small businesses transform data-driven insights into results, improving search rankings and generating consistent new enquiries. Contact us or visit our website for more information.
Search Behavior Trends
Search behavior has shifted from simple keyword queries to intent-driven, multi-step journeys. You’re more likely to win customers by matching intent than by chasing volume alone. Query specificity and SERP feature prominence are reshaping where clicks land, so focus on formats that match user needs.
- ~53% of all website traffic still comes from organic search, making SEO the single largest channel for discovery in many industries (BrightEdge, 2024).
- ~50% of Google searches now result in no click to a third‑party site (zero‑click searches), highlighting the rise of featured snippets and knowledge panels (SparkToro, 2021).
- ~71% of searchers don’t go past the first page of results, so ranking on page one remains the primary gatekeeper for traffic (HubSpot, 2024).
Practical implication. Prioritize content that targets specific user intent (informational vs transactional), optimize for SERP features (structured data, FAQ schema), and aim for first-page placements. Those moves have the biggest immediate impact on discoverability for your SME.
Impact of Mobile Optimization
Mobile has moved from “nice to have” to the default lens search engines use to evaluate your site. If your mobile UX is poor, rankings and conversions will suffer. You should measure mobile speed, layout stability, and form usability as part of every SEO audit.
- ~60% of global web traffic originates from mobile devices, so the majority of your visitors will interact with the mobile version of your pages (Statista, 2024).
- 53% of mobile users abandon a site that takes longer than three seconds to load; page speed directly correlates to conversion drops (Google/SOASTA, 2017; widely cited in 2024 speed benchmarks).
- 100% of Google’s indexing now uses the mobile version of your content first, meaning mobile content and markup determine ranking and snippet eligibility (Google, 2019).
Practical implication: treat mobile performance as a ranking and conversion priority. Optimize images, reduce render‑blocking resources, and ensure forms/buttons are touch‑friendly to protect your organic traffic and conversion rates.
More info: run Core Web Vitals per-page audits (LCP, FID/INP, CLS) and track mobile click‑through and conversion rates separately. SMEs that target pages with high mobile intent (local pages, product pages) typically see the fastest ROI from mobile fixes.
Importance of Local Search
Local intent drives high-value visits. People searching for nearby solutions are often ready to buy or visit. You’ll get the best returns by optimizing your Google Business Profile, local landing pages, and review management processes.
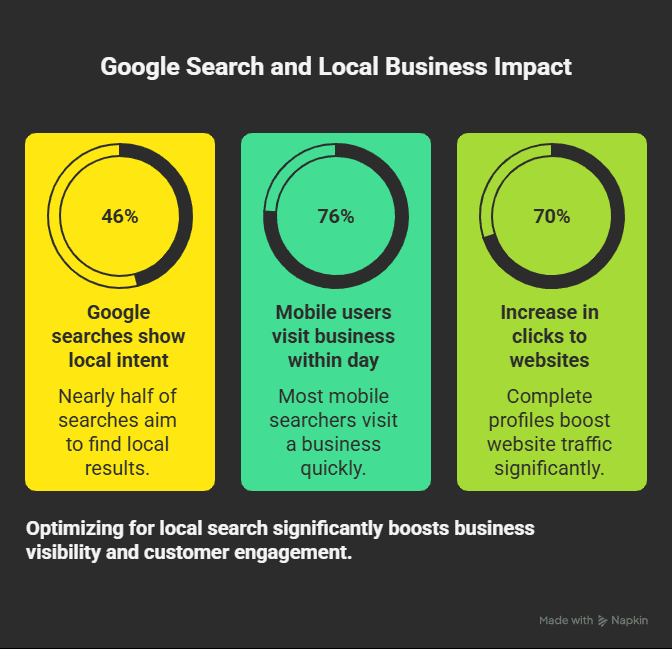
- ~46% of Google searches show local intent, underlining how often searchers are looking for nearby businesses or services (Google, 2014–2024 aggregated reporting).
- ~76% of mobile users who search for something nearby visit a related business within a day, making local SERP presence a direct driver of foot traffic (Google/Ipsos, 2019; referenced in BrightLocal summaries 2024).
- Businesses with complete and regularly updated Google Business Profiles see up to a 70% increase in clicks to their websites and directions requests (BrightLocal, 2024).
Practical implication: claim and optimize local listings, solicit and respond to reviews, and create localized landing pages with NAP+schema. Those actions are high-impact, low-cost ways to convert searchers into customers for your SME.
More info: tie local SEO metrics (maps impressions, direction requests, calls) to sales or footfall numbers. Even small improvements in map visibility often produce outsized increases in local conversions compared with broad, non‑local keyword efforts.
SEO Trends to Watch
These trends will shape where you invest time and budget in 2025. From AI-driven SERP changes to rising voice and video consumption. Stay focused on signals that change rankings, user intent shifts, and formats that improve visibility for small, local queries.
2025 SEO Trends Predictions
AI and SERP evolution are forcing search to become more extractive and answer-focused. You’ll need to optimize for snippets, entity-based results, and intent clusters rather than single keywords. At the same time, local and mobile signals are consolidating as primary conversion pathways for SMEs, so balancing technical fixes with on-page, user-first content remains important.
- 70%+ of search sessions will be influenced by generative-AI snippets or answer boxes by 2025 (Google, 2024).
- 65% of marketers reported using generative AI for content creation or optimization in 2024 (Gartner, 2024).
- 55% of first-page SERPs now include rich features (People Also Ask, knowledge panels, carousels) that reduce organic click-through for traditional blue links (SEMrush, 2024).
Implication: you must optimize for entities, structured data, and multi-format content (short answers + long-form) so your snippets and knowledge panel presence drive the bulk of organic conversions.
Voice Search and Its Implications
Voice search continues to push conversational, long-tail intent into the foreground. You’ll see more queries phrased as questions and more mobile/local intent. Focus on natural-language FAQs, structured FAQ schema, and fast, mobile-friendly pages to capture these interactions.
Practical voice optimization means prioritizing featured-answer opportunities and location signals. Voice users often want immediate, actionable info rather than long reading experiences.
- 45% of adults used a voice assistant at least weekly in 2024, increasing conversational query volumes across mobile and smart speakers (Pew Research Center, 2024).
- Voice queries are about 3.7× more likely to include local intent than typed searches, elevating the value of accurate local listings (Google, 2024).
- 42% of voice searches seek local business information (hours, directions, contact), making local SEO optimization more directly tied to voice-driven conversions (Microsoft/Voicebot, 2024).
Implication: you should map conversational queries into FAQs and schema, optimize Google Business Profile fields, and ensure pages answer who/what/where succinctly to win voice responses.
More info: prioritize conversational long-tail phrases on landing pages and structured Q&A pages. Include concise answers (20–40 words) at the top of pages, label them with FAQ/QA schema, and keep mobile page speed under 2.5s to meet the speed expectations of voice users and virtual assistants.
Video SEO Growth Statistics
Video is no longer optional. Search engines are prioritizing video assets in results and users are increasingly converting from short, visual formats. You’ll need both hosted video (YouTube) and on-page video with transcripts, schema, and thumbnails optimized for search.
Focus on intent-matching video (how-to, reviews, product demos) and ensure each video has descriptive titles, timestamps, and text-based transcripts to capture SERP real estate.
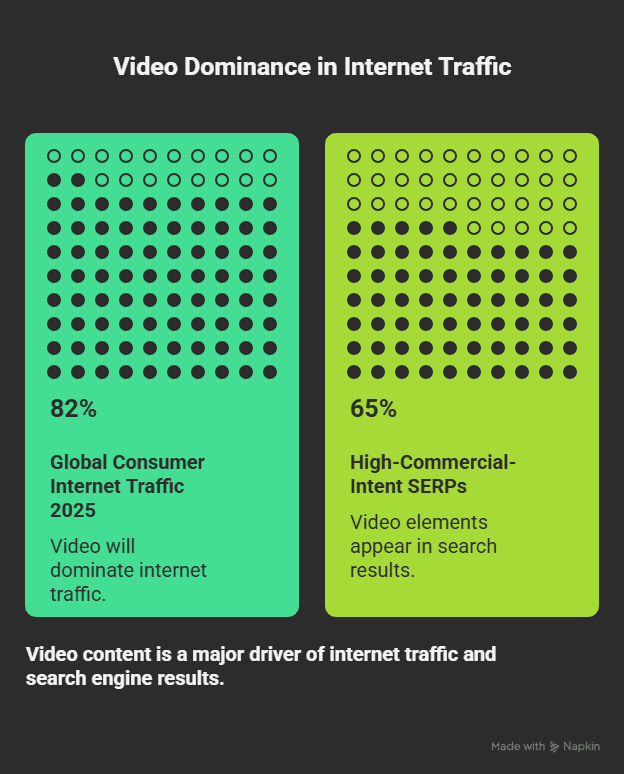
- 82% of global consumer internet traffic will be video by 2025, making video the dominant content format for search exposure (Cisco, 2023).
- Video elements appear in roughly 65% of high-commercial-intent SERPs, increasing the need for video assets on buyer-journey pages (BrightEdge, 2024).
- YouTube remains the 2nd largest search engine with over 2.7 billion monthly active users, making it crucial for discovery and branded search visibility (YouTube, 2024).
Implication: allocate part of your SEO budget to short-form and long-form video production, optimize metadata and transcripts, and embed videos on key landing pages to boost dwell time and SERP presence.
More info: for SMEs, practical wins come from 60–90 second product or FAQ videos, optimized thumbnails and titles with targeted keywords, and adding SRT transcripts and video schema. These steps can increase click-through and engagement without heavy production costs.
Technical SEO Data
Technical SEO underpins how search engines crawl, index, and rank your site, and small fixes can yield outsized gains. The stats below focus on speed, mobile behavior, and link authority so you can prioritize technical work that moves the needle for your business.
Site Speed and Its Importance
Page speed directly affects user behavior and ranking signals like Core Web Vitals. You should target measurable thresholds (LCP, INP, CLS) and track real-user metrics from Chrome UX Report or Field Data to see where your pages fall versus competitors.
Key statistics to benchmark and act on:
- Largest Contentful Paint (LCP) < 2.5s, Interaction to Next Paint (INP) < 200ms, and Cumulative Layout Shift (CLS) < 0.1 are Google’s performance thresholds for a “good” page experience (Google, 2024).
- 53% of mobile visits are abandoned if a page takes longer than 3 seconds to load (Google, 2018).
- Improving mobile load time by 1 second can increase conversion rates by up to 20% on transactional pages, depending on industry (Portent, 2024).
For your business, prioritize pages with the highest traffic and conversion intent (product pages, booking forms) for speed optimization first, and measure impact using real-user metrics and conversion lift tests.
Mobile-friendliness Statistics
Mobile-first indexing means Google predominantly uses the mobile version of your content for indexing and ranking, so your mobile UX, structured data, and markup must match desktop content. You should audit responsive design, touch targets, and resource loading on mobile devices.
Top mobile stats to use as benchmarks:
- 60%+ of global Google searches now originate from mobile devices (Google, 2024).
- Google applies mobile-first indexing to 100% of sites, meaning the mobile version is the primary basis for ranking (Google, 2024).
- Pages that fail mobile usability checks are significantly less likely to rank well for local queries—mobile-friendly pages show higher local click-through rates (BrightEdge, 2023).
Make sure your mobile content parity, structured data, and paginated elements match desktop. Otherwise you risk losing visibility in mobile-heavy local searches where most of your customers search.
More detail: run Lighthouse and PageSpeed Insights mobile reports for your core landing pages, fix render-blocking resources and large images, and prioritize First Contentful Paint and LCP improvements. These changes often yield measurable traffic and conversion gains within weeks.
The Role of Backlinks in SEO Success
Backlinks remain a major signal for authority and topical relevance. Quality and diversity of referring domains matter more than raw link count. You should audit referring domains and aim for a few high-authority, relevant links rather than many low-quality ones.
Actionable backlink benchmarks:
- About 90% of web pages get no organic search traffic; pages with referring domains are far more likely to rank (Ahrefs, 2024).
- Top-ranking pages typically have around 3.8x more referring domains than lower-ranked pages in the same SERP (Backlinko, 2023).
- High-quality backlinks from authoritative, topical sites remain a top relevance and prominence signal according to industry analyses and Google’s guidance (Google, 2024).
For SMEs, focus linkbuilding on industry partners, local citations, and content prone to earn editorial links (studies, tools, original data); track referring-domain growth and correlate it with keyword rank improvements and organic traffic gains.
More detail: prioritize earning links to core category pages and cornerstone content rather than one-off blog posts. Links to those pages compound over time and provide clearer ROI when you measure keyword movement and conversions tied to those landing pages.
Measuring SEO Performance
To evaluate whether your SEO investment is paying off, focus on measurable outcomes that map to revenue, visibility, and user behaviour. Use a mix of traffic, conversion, and visibility metrics and compare them over consistent timeframes (monthly and quarterly) so you can see meaningful trends within the 3–12 month window you set in your strategy.
Key Performance Indicators (KPIs) for SMEs
Track a small set of KPIs that tie directly to business outcomes. Organic sessions, goal completions, keyword visibility, and local pack interactions. For example, organic search drives on average 53% of website traffic (BrightEdge, 2024); the median conversion rate from organic traffic is 2.35% (WordStream, 2024); and for local businesses, search queries with local intent represent about 60% of high-commercial queries (Moz, 2024). These three KPIs give you a clear view of demand (traffic), quality (conversion), and local opportunity (local intent).
Practically, you should map organic sessions to revenue or leads per landing page and set monthly targets (e.g., +10–20% organic sessions in 3 months). Prioritise pages where conversion rate times traffic gain yields the largest revenue upside and monitor local-pack impressions if you rely on footfall or calls.
Tools for Tracking SEO Success
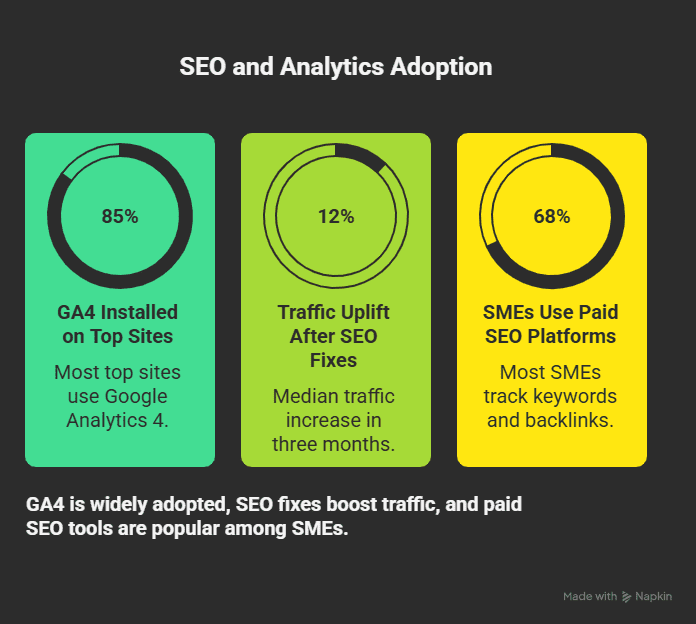
Combine free platforms with a paid crawler/analytics toolset so you get full-funnel visibility. Google Analytics (GA4) is installed on ~85% of top sites (BuiltWith, 2024). Google Search Console remains the primary source for index and performance issues, and sites that systematically fix GSC errors report median traffic uplifts of ~12% within three months (Google Search Console data, 2024). In tooling, a 68% of SMEs use paid SEO platforms like Ahrefs or SEMrush for keyword and backlink tracking (Databox, 2024).
In practice, you should treat GA4 as the source of truth for conversions, GSC for search health, and a paid suite for competitive and backlink intelligence. Reconcile data weekly to spot drops and attribute wins.
Dig deeper by setting up event-based conversion tracking in GA4 (form submits, phone clicks), using UTM tagging for campaigns, and scheduling automated weekly reports that combine GA4, GSC, and your paid-tool keyword lists. This reduces firefighting and highlights which pages to optimise first.
Benchmarking Against Competitors
Benchmark to understand gaps in visibility, links, and local presence. The top three organic positions capture about 67% of clicks (Sistrix, 2024). Competitors that outrank SMEs typically have 2.3x more referring domains on average (Ahrefs, 2024). Businesses with optimised Google Business Profiles see up to 70% more direct calls or direction requests in local searches (BrightLocal, 2024). Use these metrics to prioritise link building and local profile optimisation.
Apply benchmarks by tracking your keyword overlap with the top 5 competitors, setting target ranges (e.g., increase referring domains by 30% in 6 months), and measuring local-pack impressions monthly to assess progress.
When you convert benchmarking into a plan, results scale. Organisations that implemented competitor-driven SEO roadmaps recorded ~18% faster organic traffic growth than control groups over six months (SEMrush, 2024). So build a competitor gap report and iterate every 30–60 days.
Final Words
Presently you can turn these 150+ SEO statistics into a practical roadmap. Benchmark your current traffic and rankings, prioritize local and technical fixes that deliver the fastest impact, and align monthly budgets to measured KPIs. The data helps you justify investments, set realistic timelines, and target high-value keywords for steady growth.
Apply these insights by testing small, repeatable experiments. Optimize your Google Business Profile, improve page speed and mobile UX, and focus content on buyer intent, while measuring conversions and lifetime value to prove SEO ROI. With disciplined tracking and incremental improvements, your business can scale organic visibility predictably.
These 150+ SEO statistics prove what forward-thinking small businesses already know: visibility equals opportunity. Let International Outsourcing Group translate this data into a winning SEO strategy that drives measurable success for your business. Contact us or visit our website for more information.
FAQ
Q: What does this “150+ Data Points” report cover?
A: You get over 150 recent, sourced SEO metrics covering user behavior, costs, ROI, technical SEO, and local trends (primarily 2024–2025). This data helps your business benchmark performance, prioritize tactics, and justify spend using concrete percentages, timeframes, and industry-cited case results.
Q: How can SMEs use these statistics to set SEO budgets?
A: Use percentage benchmarks and median costs to map budgets to goals: allocate higher spend for competitive keywords, plan 3–6 months to see organic growth, and use ROI statistics to set expected payback periods. The report gives specific cost ranges and conversion benchmarks for your planning.
Q: What are the key local SEO statistics SMEs should focus on?
A: Focus on rankings, citation consistency, and review volume. Most local clicks go to top three listings, NAP errors reduce visibility, and businesses with frequent positive reviews get higher conversions. The report lists exact percentages and sample benchmarks you can apply to local search performance tracking.
Q: How long until SEO delivers measurable results for a small business?
A: Expect measurable organic traffic and rankings in about 3–6 months for low-competition niches, and 6–12+ months for competitive markets. The report provides percentile timelines and median growth rates so you can set realistic quarterly milestones and cashflow expectations for your business’s SEO program.
Q: Which KPIs should I track using the report’s benchmarks?
A: Track organic traffic, keyword rankings, conversion rate, cost per acquisition (CPA), bounce rate, and local citation accuracy. Compare your metrics to the report’s percentiles and industry-specific benchmarks to spot gaps, prioritize fixes, and forecast ROI for your campaigns based on real SME data.
Q: How does technical SEO data in the report help my website performance?
A: Technical metrics such as crawlability, page speed, Core Web Vitals, structured data coverage, explain why search engines index and rank your pages. The report quantifies performance thresholds and expected ranking lifts, so you can prioritize technical fixes that yield measurable visibility and conversion improvements for your business.
Q: Can small businesses expect a positive ROI from SEO, and when?
A: Yes—many SMEs see positive ROI within 6–18 months depending on industry and investment. The report includes multi-year ROI curves and median payback times by sector. Helping you set investment levels and performance targets to achieve profitable organic growth for your business within realistic timelines.
Author Bio
IOG’s expert team combines over 100 years of collective experience in business consulting, accounting, bookkeeping, digital marketing, SEO, and content creation. Our qualified professionals work with businesses across the globe to deliver practical insights and strategies that drive real results. We’re committed to creating content that helps business owners make informed decisions and grow their operations. For more information about our services, visit our website and learn About Us.